> ## Documentation Index
> Fetch the complete documentation index at: https://docs.automq.com/llms.txt
> Use this file to discover all available pages before exploring further.
# Integrating Metrics with Datadog
> Send AutoMQ metrics to Datadog using the Datadog Agent on Kubernetes or Vector on Linux. Covers both OpenTelemetry Collector and Prometheus Remote Write approaches.
AutoMQ supports exporting metrics to [Datadog](https://www.datadoghq.com/) for monitoring and alerting. This guide covers two integration approaches based on your deployment environment:
* **Kubernetes**: Use the Datadog Agent with its built-in OpenTelemetry (OTEL) Collector to scrape Prometheus metrics from AutoMQ pods.
* **Linux (EC2 / VM)**: Use [Vector](https://vector.dev/) to receive AutoMQ's Prometheus Remote Write data and forward it to Datadog.
## Prerequisites
* A running AutoMQ cluster with metrics export enabled
* A valid [Datadog API Key](https://docs.datadoghq.com/account_management/api-app-keys/)
* Your Datadog Site URL (e.g., `datadoghq.com`, `us3.datadoghq.com`, `datadoghq.eu`)
## Option 1: Kubernetes with Datadog Agent (OTEL Collector)
In this approach, the Datadog Agent runs as a DaemonSet with an embedded OTEL Collector. The Collector scrapes Prometheus metrics from AutoMQ pods using Kubernetes service discovery, then exports them to Datadog.
```text theme={null}
AutoMQ Pods (Prometheus metrics endpoint on port 9090)
↓ Prometheus scrape (Kubernetes service discovery)
Datadog Agent (built-in OTEL Collector)
↓ Export to Datadog
Datadog
```
### Step 1: Configure AutoMQ metrics export
When deploying AutoMQ on Kubernetes via Helm, set the metrics exporter to Prometheus mode in your Helm values:
```yaml theme={null}
global:
config: |
s3.telemetry.metrics.exporter.uri=prometheus://?host=0.0.0.0&port=9090
```
This exposes Prometheus-format metrics on port 9090 of each AutoMQ pod.
To let the Datadog Agent discover these pods, add the following entries under `controller.annotations` and `broker.annotations`:
```yaml theme={null}
controller:
annotations:
prometheus.io/automq-scrape: "true"
prometheus.io/automq-port: "9090"
prometheus.io/automq-path: "/metrics"
broker:
annotations:
prometheus.io/automq-scrape: "true"
prometheus.io/automq-port: "9090"
prometheus.io/automq-path: "/metrics"
```
These annotation keys map directly to the `relabel_configs` in Step 2.
### Step 2: Create the Datadog Agent values file
Create a `datadog-values.yaml` file with the OTEL Collector configuration. The Collector uses Kubernetes service discovery to find AutoMQ pods annotated for scraping.
```yaml theme={null}
datadog:
otelCollector:
enabled: true
config: |
receivers:
prometheus:
config:
scrape_configs:
- job_name: "automq"
scrape_interval: 15s
kubernetes_sd_configs:
- role: pod
relabel_configs:
- source_labels: [__meta_kubernetes_pod_annotation_prometheus_io_automq_scrape]
action: keep
regex: true
- source_labels: [__address__, __meta_kubernetes_pod_annotation_prometheus_io_automq_port]
action: replace
regex: ([^:]+)(?::\d+)?;(\d+)
replacement: $1:$2
target_label: __address__
- source_labels: [__meta_kubernetes_pod_annotation_prometheus_io_automq_path]
action: replace
target_label: __metrics_path__
regex: (.+)
exporters:
datadog:
api:
key: ${env:DD_API_KEY}
site: ${env:DD_SITE}
processors:
infraattributes:
cardinality: 2
service:
pipelines:
metrics:
receivers: [prometheus]
processors: [infraattributes]
exporters: [datadog]
```
This example uses the following components:
| Component | Purpose |
| --------------------------- | --------------------------------------------------------------------------------------------------------------------------------------------------------------------------------------------------------- |
| `prometheus` receiver | Uses Kubernetes service discovery to find AutoMQ pods and scrape their Prometheus metrics endpoint. The `relabel_configs` rules filter pods by annotation and rewrite the scrape target address and path. |
| `datadog` exporter | Sends metrics to Datadog. The API key and site come from the Agent's environment variables. |
| `infraattributes` processor | Optional. Adds Datadog infrastructure tags when the required resource attributes are available. |
This example includes a Prometheus scrape job and a metrics pipeline for AutoMQ. It also uses the optional `infraattributes` processor to add Datadog infrastructure tags when the required resource attributes are available. The OTLP receiver and other pipelines (traces, logs) are omitted. If you need to collect OTLP data from other applications through the same Collector, refer to the [Datadog DDOT Collector documentation](https://docs.datadoghq.com/opentelemetry/setup/ddot_collector/install/kubernetes_daemonset/?tab=helm) to add the corresponding receivers and pipelines.
If your AutoMQ nodes run on dedicated Kubernetes nodes with taints, add tolerations so the Datadog Agent DaemonSet can schedule on those nodes:
```yaml theme={null}
agents:
tolerations:
- key: "dedicated"
operator: "Equal"
value: "automq"
effect: "NoSchedule"
```
### Step 3: Deploy the Datadog Agent
Add the Datadog Helm repository and create a Kubernetes secret for your API key:
```bash theme={null}
helm repo add datadog https://helm.datadoghq.com
helm repo update
```
```bash theme={null}
kubectl create secret generic datadog-secret \
--from-literal api-key=
```
Install the Datadog Agent using the values file from Step 2:
```bash theme={null}
helm install datadog-agent datadog/datadog \
-f datadog-values.yaml \
-n datadog --create-namespace \
--set datadog.apiKeyExistingSecret=datadog-secret \
--set datadog.site=
```
Replace `` with your Datadog Site (e.g., `datadoghq.com`, `us3.datadoghq.com`, `datadoghq.eu`).
### Step 4: Verify in Datadog
1. Open Datadog and go to **Metrics > Explorer**.
2. Search for AutoMQ metrics by typing a metric name prefix in the search bar.
3. New metrics may take 1–3 minutes to appear.
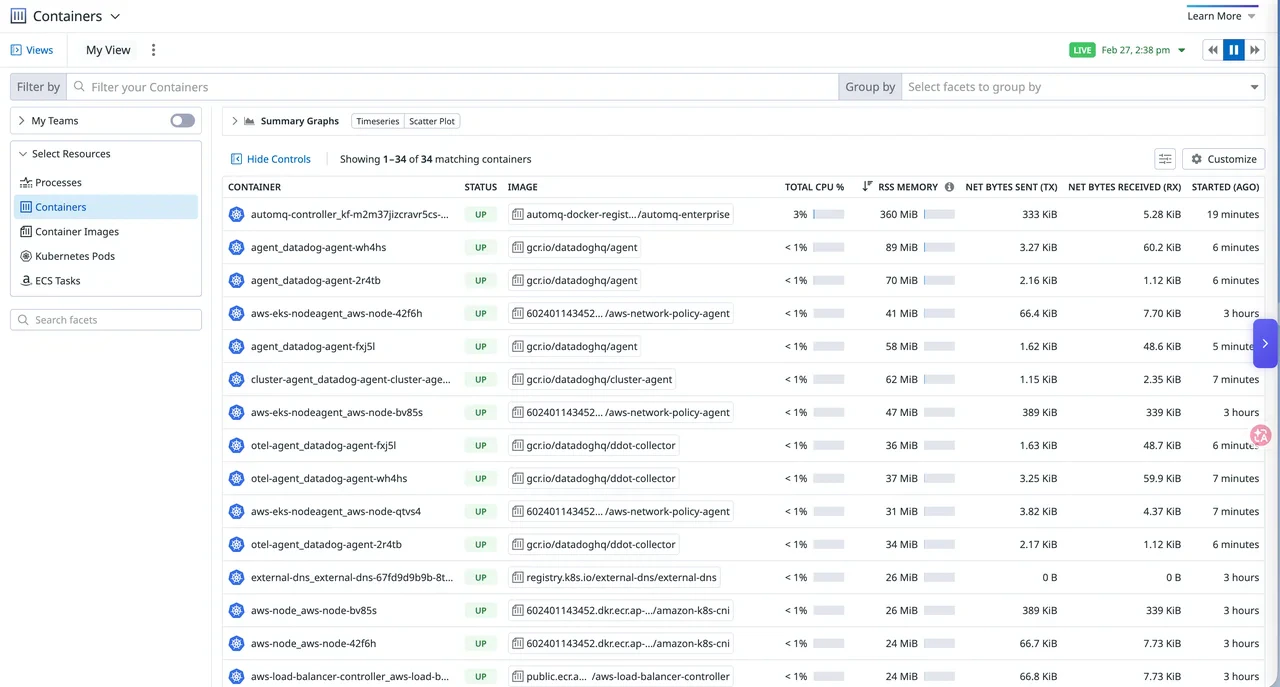
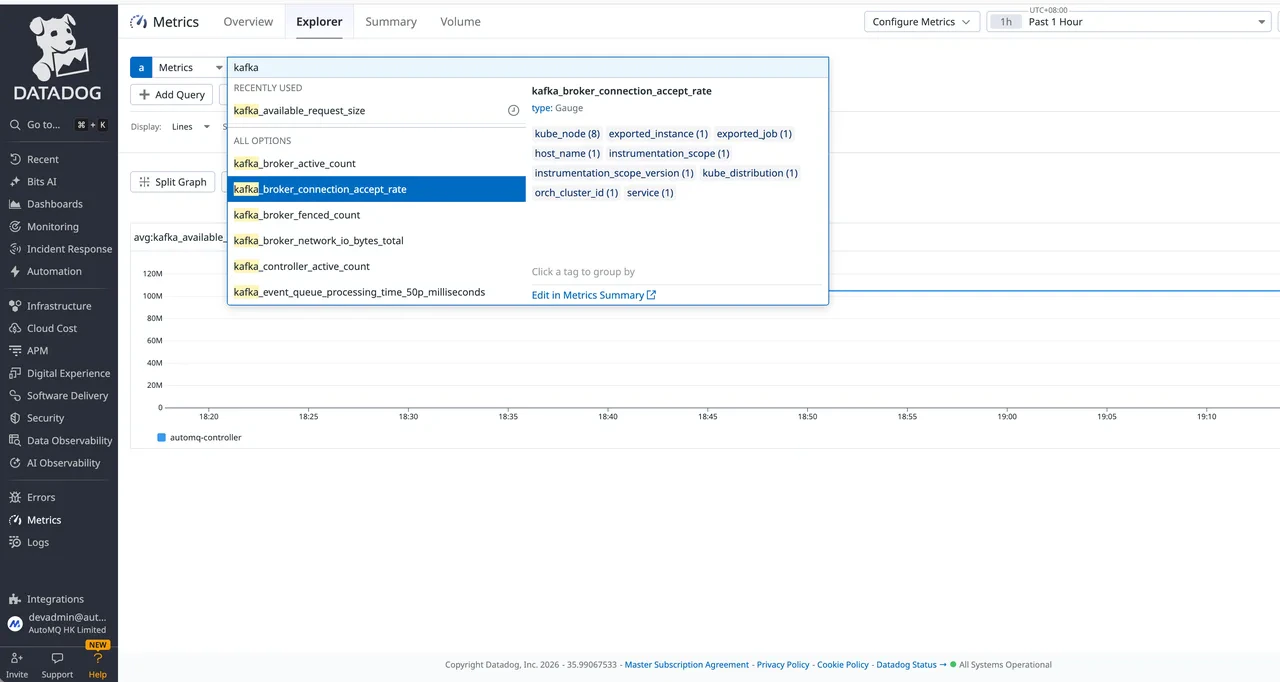 AutoMQ metrics use Prometheus naming conventions with underscores (e.g., `kafka_request_time_mean_milliseconds`). Datadog's built-in Apache Kafka dashboards rely on the Datadog Kafka integration, which uses dot-separated names (e.g., `kafka.request.time`). As a result, AutoMQ metrics do not appear in those built-in dashboards. Use Datadog Metrics Explorer to query AutoMQ metrics directly, or build custom dashboards using the underscore-separated names. For available metrics, see [Prometheus Metrics](/automq/observability/prometheus-metrics).
The screenshots below illustrate this naming difference — Datadog's built-in dashboard uses dot-separated format, while AutoMQ metrics use underscore-separated format:
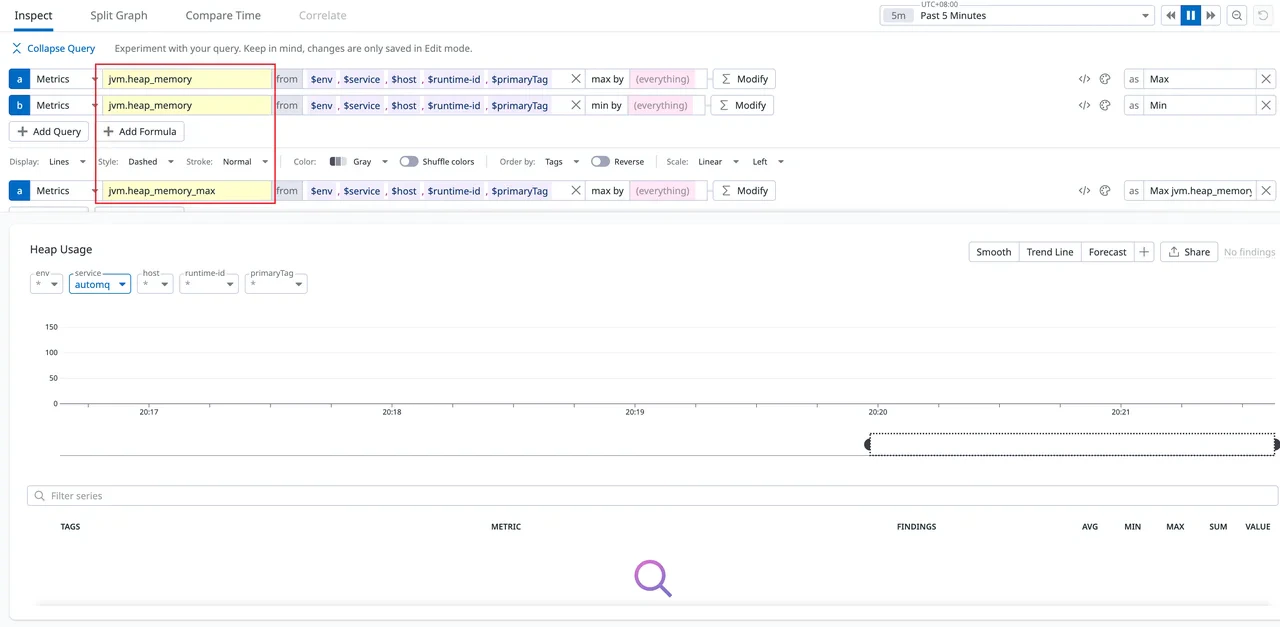
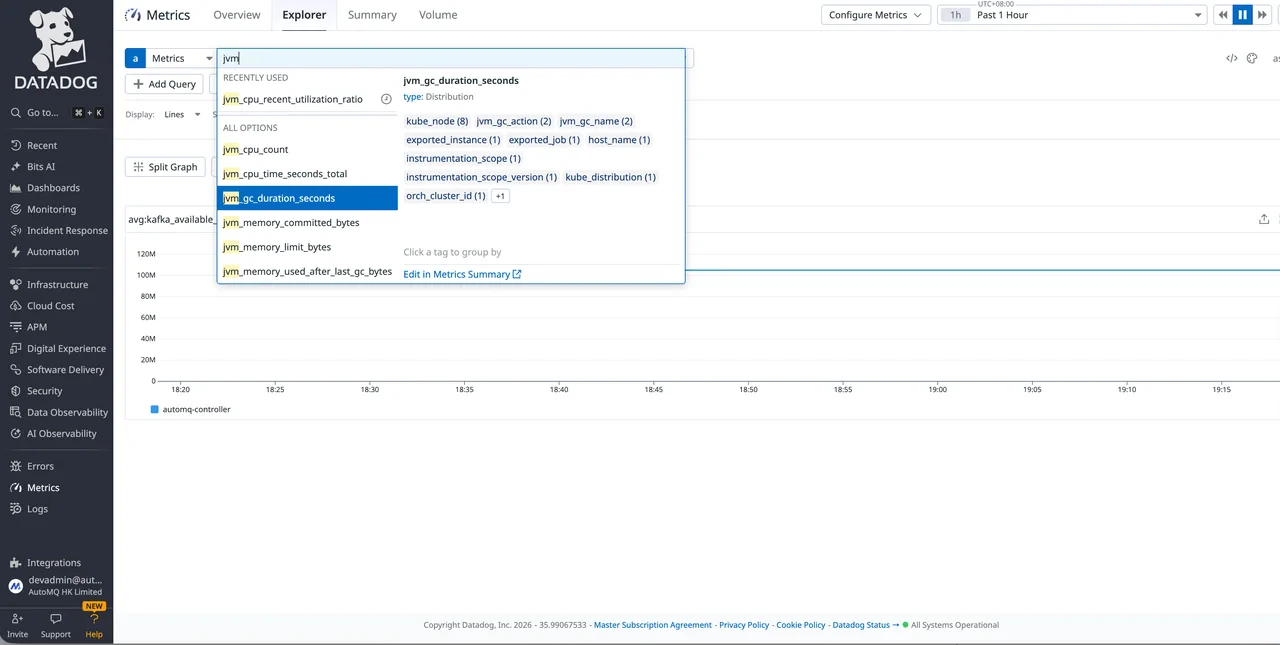
AutoMQ metrics use Prometheus naming conventions with underscores (e.g., `kafka_request_time_mean_milliseconds`). Datadog's built-in Apache Kafka dashboards rely on the Datadog Kafka integration, which uses dot-separated names (e.g., `kafka.request.time`). As a result, AutoMQ metrics do not appear in those built-in dashboards. Use Datadog Metrics Explorer to query AutoMQ metrics directly, or build custom dashboards using the underscore-separated names. For available metrics, see [Prometheus Metrics](/automq/observability/prometheus-metrics).
The screenshots below illustrate this naming difference — Datadog's built-in dashboard uses dot-separated format, while AutoMQ metrics use underscore-separated format:
 ## Option 2: Linux with Vector (Prometheus Remote Write)
In this approach, AutoMQ pushes metrics to a local [Vector](https://vector.dev/) instance using the Prometheus Remote Write protocol. Vector transforms and forwards the data to Datadog.
Vector is an observability data pipeline maintained by Datadog. For a metrics-only forwarding path on a standalone Linux host, it is a focused alternative to the full Datadog Agent.
```text theme={null}
AutoMQ (Linux process)
↓ Prometheus Remote Write (HTTP POST, protobuf/snappy)
Vector (Remote Write endpoint on port 9090 at /api/v1/write)
↓ Forward to Datadog
Datadog
```
### Step 1: Configure AutoMQ metrics export
Set the metrics exporter to Remote Write mode in AutoMQ's `server.properties` (or startup configuration), pointing to the local Vector instance:
```properties theme={null}
s3.telemetry.metrics.exporter.uri=rw://?endpoint=http://localhost:9090/api/v1/write
```
* `rw://` is AutoMQ's Prometheus Remote Write exporter protocol prefix.
* `endpoint` points to Vector's `prometheus_remote_write` source address.
AutoMQ's Remote Write URI supports multiple authentication methods. Since Vector runs on the same host, authentication is typically not required.
| Authentication | URI Format |
| -------------- | ------------------------------------------------------------------------------------------------ |
| None (default) | `rw://?endpoint=http://localhost:9090/api/v1/write` |
| Basic Auth | `rw://?endpoint=http://localhost:9090/api/v1/write&auth=basic&username=${user}&password=${pass}` |
| Bearer Token | `rw://?endpoint=http://localhost:9090/api/v1/write&auth=bearer&token=${token}` |
### Step 2: Install Vector
```bash theme={null}
curl --proto '=https' --tlsv1.2 -sSfL https://sh.vector.dev | bash -s -- -y
```
Confirm the installation:
```bash theme={null}
vector --version
```
### Step 3: Configure Vector
Create the Vector configuration file:
```bash theme={null}
sudo mkdir -p /etc/vector
```
```bash theme={null}
sudo tee /etc/vector/vector.toml > /dev/null << 'EOF'
[sources.automq_in]
type = "prometheus_remote_write"
address = "0.0.0.0:9090"
path = "/api/v1/write"
[transforms.add_tags]
type = "remap"
inputs = ["automq_in"]
source = '''
.tags.service = "automq"
.tags.env = "local-test"
'''
[sinks.datadog_out]
type = "datadog_metrics"
inputs = ["add_tags"]
default_api_key = "${DATADOG_API_KEY}"
site = "${DATADOG_SITE}"
EOF
```
The `transforms.add_tags` section is optional but recommended for filtering metrics in Datadog.
### Step 4: Start Vector
**For debugging** — run Vector in the foreground:
```bash theme={null}
DATADOG_API_KEY="" \
DATADOG_SITE="" \
vector --config /etc/vector/vector.toml
```
**For production** — run Vector as a systemd service:
```bash theme={null}
sudo mkdir -p /etc/default
sudo tee /etc/default/vector > /dev/null << 'EOF'
DATADOG_API_KEY=
DATADOG_SITE=
EOF
```
Limit access to this file because it contains your Datadog API key. Also avoid pasting real keys into shared shell history or logs.
```bash theme={null}
sudo chmod 600 /etc/default/vector
```
```bash theme={null}
sudo tee /etc/systemd/system/vector.service > /dev/null << 'EOF'
[Unit]
Description=Vector
Documentation=https://vector.dev
After=network-online.target
Requires=network-online.target
[Service]
User=vector
Group=vector
EnvironmentFile=/etc/default/vector
ExecStart=/usr/bin/vector --config /etc/vector/vector.toml
Restart=always
RestartSec=5
[Install]
WantedBy=multi-user.target
EOF
sudo systemctl daemon-reload
sudo systemctl enable vector
sudo systemctl start vector
```
### Step 5: Verify
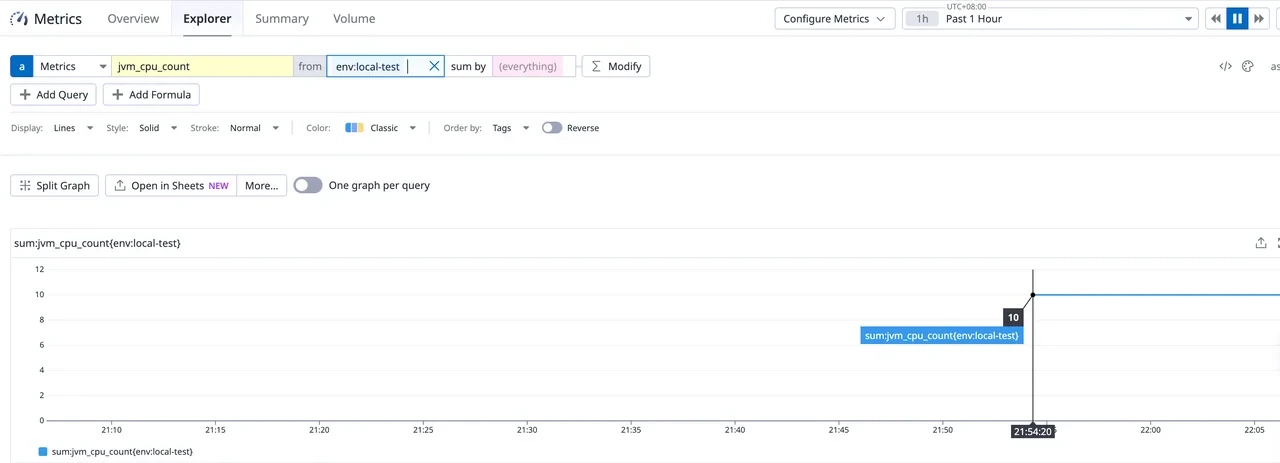
Open Datadog **Metrics > Explorer**, search for AutoMQ metrics, and filter by the `env` and `service` tags. New metrics may take 1–3 minutes to appear.
## Option 2: Linux with Vector (Prometheus Remote Write)
In this approach, AutoMQ pushes metrics to a local [Vector](https://vector.dev/) instance using the Prometheus Remote Write protocol. Vector transforms and forwards the data to Datadog.
Vector is an observability data pipeline maintained by Datadog. For a metrics-only forwarding path on a standalone Linux host, it is a focused alternative to the full Datadog Agent.
```text theme={null}
AutoMQ (Linux process)
↓ Prometheus Remote Write (HTTP POST, protobuf/snappy)
Vector (Remote Write endpoint on port 9090 at /api/v1/write)
↓ Forward to Datadog
Datadog
```
### Step 1: Configure AutoMQ metrics export
Set the metrics exporter to Remote Write mode in AutoMQ's `server.properties` (or startup configuration), pointing to the local Vector instance:
```properties theme={null}
s3.telemetry.metrics.exporter.uri=rw://?endpoint=http://localhost:9090/api/v1/write
```
* `rw://` is AutoMQ's Prometheus Remote Write exporter protocol prefix.
* `endpoint` points to Vector's `prometheus_remote_write` source address.
AutoMQ's Remote Write URI supports multiple authentication methods. Since Vector runs on the same host, authentication is typically not required.
| Authentication | URI Format |
| -------------- | ------------------------------------------------------------------------------------------------ |
| None (default) | `rw://?endpoint=http://localhost:9090/api/v1/write` |
| Basic Auth | `rw://?endpoint=http://localhost:9090/api/v1/write&auth=basic&username=${user}&password=${pass}` |
| Bearer Token | `rw://?endpoint=http://localhost:9090/api/v1/write&auth=bearer&token=${token}` |
### Step 2: Install Vector
```bash theme={null}
curl --proto '=https' --tlsv1.2 -sSfL https://sh.vector.dev | bash -s -- -y
```
Confirm the installation:
```bash theme={null}
vector --version
```
### Step 3: Configure Vector
Create the Vector configuration file:
```bash theme={null}
sudo mkdir -p /etc/vector
```
```bash theme={null}
sudo tee /etc/vector/vector.toml > /dev/null << 'EOF'
[sources.automq_in]
type = "prometheus_remote_write"
address = "0.0.0.0:9090"
path = "/api/v1/write"
[transforms.add_tags]
type = "remap"
inputs = ["automq_in"]
source = '''
.tags.service = "automq"
.tags.env = "local-test"
'''
[sinks.datadog_out]
type = "datadog_metrics"
inputs = ["add_tags"]
default_api_key = "${DATADOG_API_KEY}"
site = "${DATADOG_SITE}"
EOF
```
The `transforms.add_tags` section is optional but recommended for filtering metrics in Datadog.
### Step 4: Start Vector
**For debugging** — run Vector in the foreground:
```bash theme={null}
DATADOG_API_KEY="" \
DATADOG_SITE="" \
vector --config /etc/vector/vector.toml
```
**For production** — run Vector as a systemd service:
```bash theme={null}
sudo mkdir -p /etc/default
sudo tee /etc/default/vector > /dev/null << 'EOF'
DATADOG_API_KEY=
DATADOG_SITE=
EOF
```
Limit access to this file because it contains your Datadog API key. Also avoid pasting real keys into shared shell history or logs.
```bash theme={null}
sudo chmod 600 /etc/default/vector
```
```bash theme={null}
sudo tee /etc/systemd/system/vector.service > /dev/null << 'EOF'
[Unit]
Description=Vector
Documentation=https://vector.dev
After=network-online.target
Requires=network-online.target
[Service]
User=vector
Group=vector
EnvironmentFile=/etc/default/vector
ExecStart=/usr/bin/vector --config /etc/vector/vector.toml
Restart=always
RestartSec=5
[Install]
WantedBy=multi-user.target
EOF
sudo systemctl daemon-reload
sudo systemctl enable vector
sudo systemctl start vector
```
### Step 5: Verify
Open Datadog **Metrics > Explorer**, search for AutoMQ metrics, and filter by the `env` and `service` tags. New metrics may take 1–3 minutes to appear.
 ## References
* [Datadog Agent Helm Chart](https://github.com/DataDog/helm-charts/tree/main/charts/datadog)
* [Datadog OTEL Collector on Kubernetes](https://docs.datadoghq.com/opentelemetry/setup/ddot_collector/install/kubernetes_daemonset/?tab=helm)
* [Vector Documentation](https://vector.dev/docs/)
* [Vector Prometheus Remote Write Source](https://vector.dev/docs/reference/configuration/sources/prometheus_remote_write/)
## References
* [Datadog Agent Helm Chart](https://github.com/DataDog/helm-charts/tree/main/charts/datadog)
* [Datadog OTEL Collector on Kubernetes](https://docs.datadoghq.com/opentelemetry/setup/ddot_collector/install/kubernetes_daemonset/?tab=helm)
* [Vector Documentation](https://vector.dev/docs/)
* [Vector Prometheus Remote Write Source](https://vector.dev/docs/reference/configuration/sources/prometheus_remote_write/)