> ## Documentation Index
> Fetch the complete documentation index at: https://docs.automq.com/llms.txt
> Use this file to discover all available pages before exploring further.
# Monitoring & Alerts via CloudWatch
> Monitor AutoMQ's Kafka-compatible metrics using CloudWatch for enhanced observability. Benefit from cloud-native scalability and cost efficiency.
Metrics are essential analytical data for system observability. AutoMQ supports exposing several native Apache Kafka® Metrics via CloudWatch.
## Metrics Collection and Application Principles
Internal components of AutoMQ support the collection of various Kafka Server Metrics data. However, the current business edition does not provide built-in Metrics dashboards and monitoring alert capabilities. Users can implement custom Metrics monitoring and analysis based on the integration features provided by AutoMQ. The overall architecture is referenced in the diagram below:
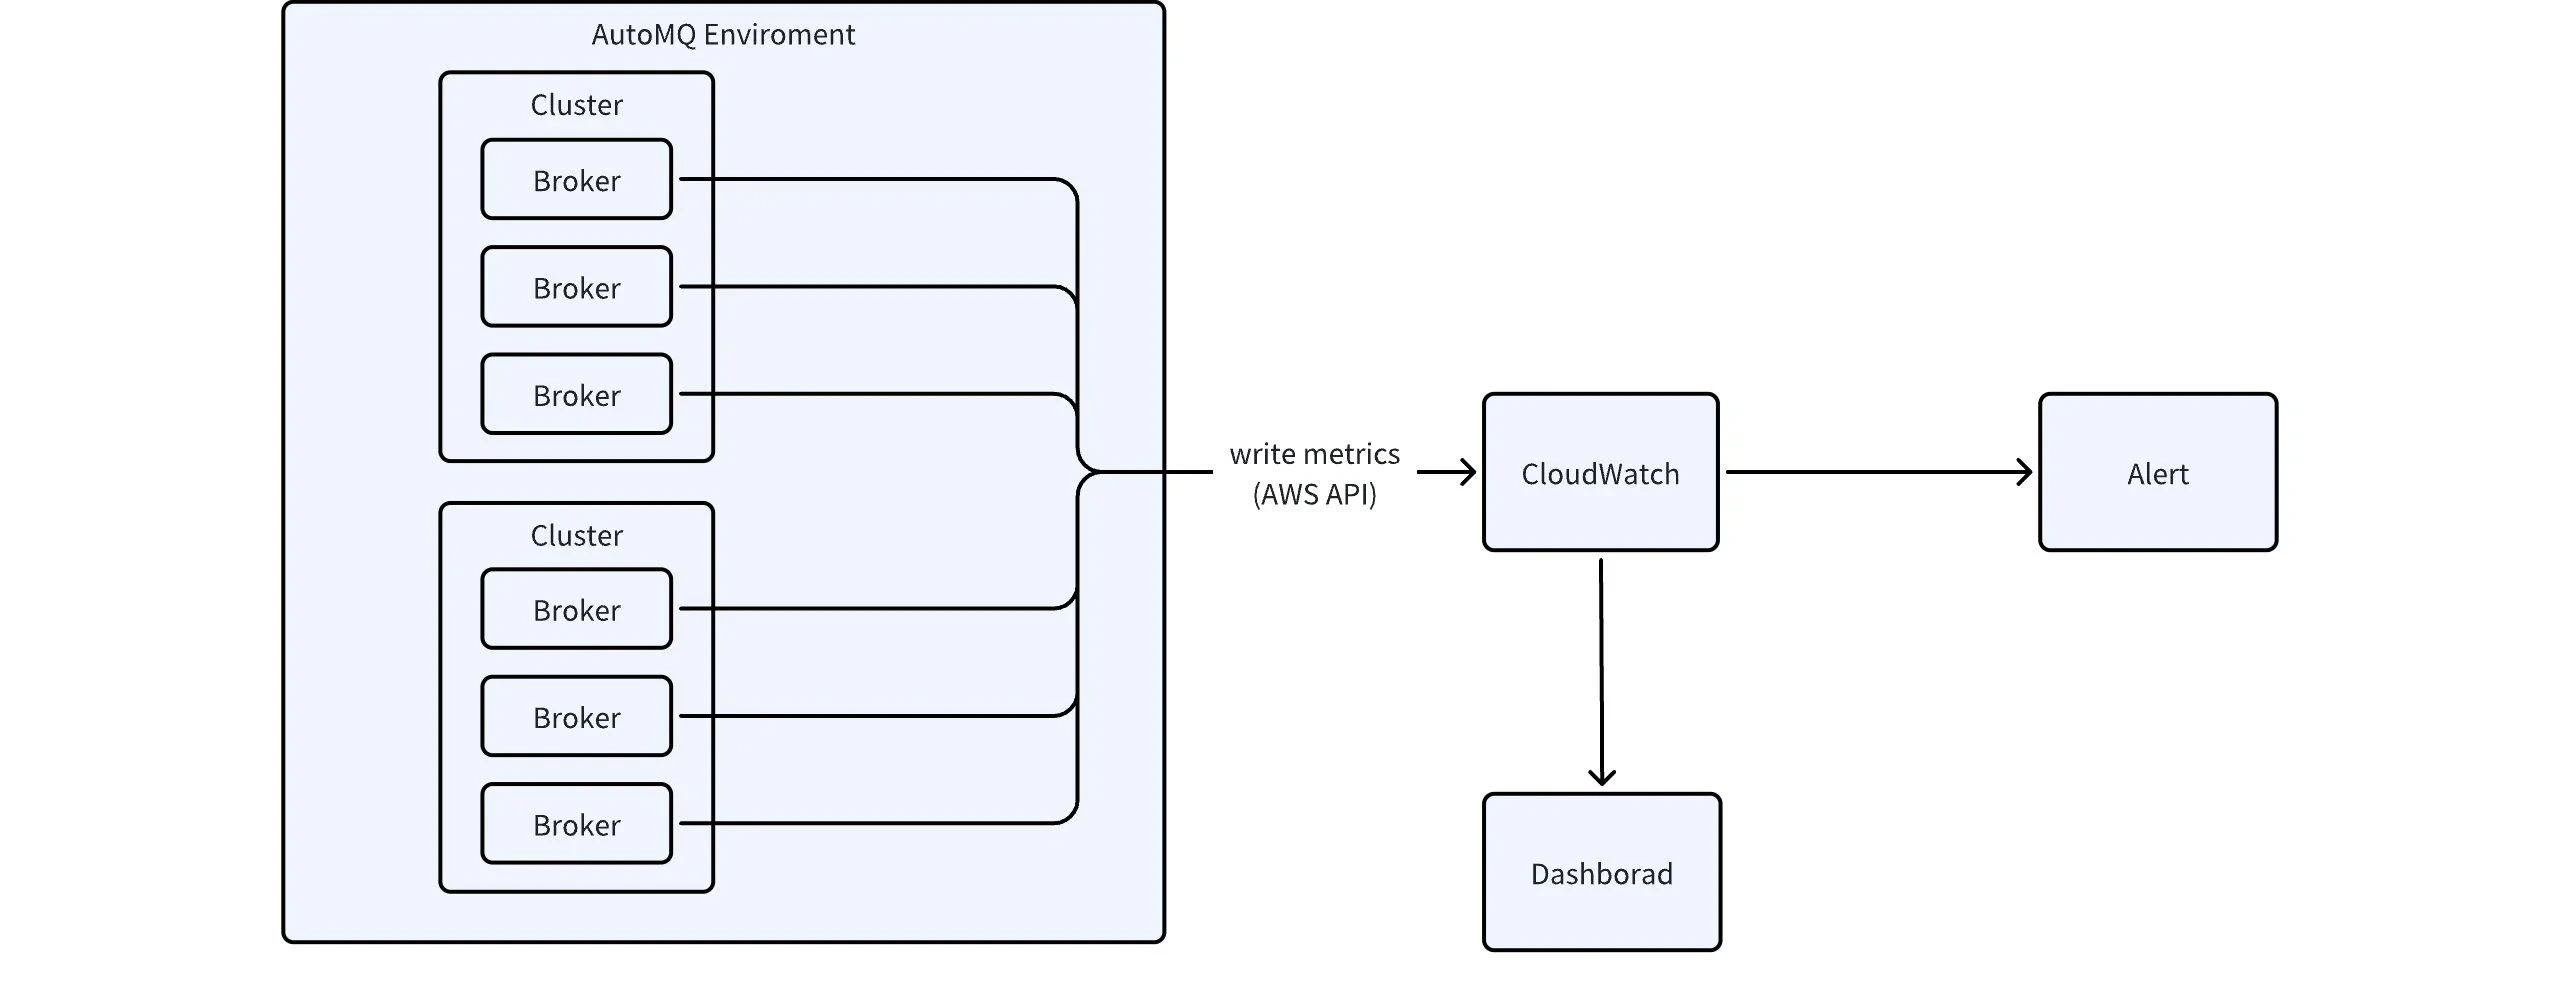 Referencing the diagram above, use the Metrics integration feature [Manage Integrations▸](/automq-cloud/manage-environments/manage-integrations) to forward Metrics data to the CloudWatch service.
## CloudWatch Metrics Definition
Detailed definitions of the relevant Metrics exposed through the above integration are as follows:
| **Metric Name**
Referencing the diagram above, use the Metrics integration feature [Manage Integrations▸](/automq-cloud/manage-environments/manage-integrations) to forward Metrics data to the CloudWatch service.
## CloudWatch Metrics Definition
Detailed definitions of the relevant Metrics exposed through the above integration are as follows:
| **Metric Name**
| **Metric Description**
|
| ----------------------------------------- | ------------------------------------------------------------------------------------------------------------------------------------------- |
| kafka\_controller\_active\_count
| - Meaning: The number of active Controller nodes, unit: count.
- Dimension: Cluster
|
| kafka\_network\_io\_bytes\_in\_sec
| - Meaning: Write traffic throughput, unit: Byte/s.
- Dimension: Cluster, Topic
|
| kafka\_network\_io\_bytes\_out\_sec
| - Meaning: Read traffic throughput, unit: Byte/s.
- Dimension: Cluster, Topic
|
| kafka\_server\_connection\_count
| - Meaning: The number of client connections, unit: count.
- Dimension: Cluster
|
| kafka\_partition\_total\_count
| - Meaning: The total number of partitions in the cluster, not considering replicas, unit: count.
- Dimension: Cluster
|
| kafka\_topic\_count
| - Meaning: The total number of Topics in the cluster, unit: count.
- Dimension: Cluster
|
| kafka\_consume\_offset\_lag
| - Meaning: The number of messages accumulated for consumption, unit: count.
- Dimension: Topic, Consumer Group
|
| kafka\_message\_count\_in\_sec
| - Meaning: The number of messages written per second, unit: messages/sec.
- Dimension: Cluster, Topic
|
| kafka\_partition\_offline\_count
| - Meaning: Number of offline, leaderless partitions in the cluster, measured in units.
- Dimension: Cluster
|
| kafka\_log\_size
| - Meaning: Size of message storage space, measured in Bytes.
- Dimension: Cluster, Topic
|