> ## Documentation Index
> Fetch the complete documentation index at: https://docs.automq.com/llms.txt
> Use this file to discover all available pages before exploring further.
# Flashcat
> AutoMQ offers cloud-native scalability, Kafka compatibility, and cost efficiency by integrating with Nightingale for robust, real-time monitoring and performance optimization.
## Introduction
Monitoring your AutoMQ cluster helps you maintain stability and optimize performance. This guide shows how to integrate AutoMQ with the Nightingale monitoring system.
### Overview of Nightingale
The Nightingale Monitoring System (Nightingale) is an open-source, cloud-native observability and analysis tool that adopts an All-in-One design philosophy, integrating data collection, visualization, monitoring alerts, and data analysis into one platform. Its main advantages include efficient data collection capabilities, flexible alert strategies, and rich visualization features. Nightingale is closely integrated with various cloud-native ecosystems, supporting multiple data sources and storage backends, and providing low-latency, high-reliability monitoring services. By using Nightingale, enterprises can achieve comprehensive monitoring and management of complex distributed systems, quickly identify and resolve issues, thereby optimizing system performance and enhancing business continuity.
![Nightingale Architecture [3]](https://mintcdn.com/automq/P6Ug3urJlyU1p2ee/automq/integrations/observability/flashcat/2.webp?fit=max&auto=format&n=P6Ug3urJlyU1p2ee&q=85&s=2fee2628fab0eb0d14554a6cd8577924) ## Prerequisites
To monitor the status of the cluster, you will need the following setup:
* Deploy an available AutoMQ node/cluster and open the Metrics collection port
* Deploy Nightingale monitoring and its dependencies
* Deploy [Prometheus](https://prometheus.io/docs/prometheus/latest/getting_started/) to collect Metrics data
## Deploy AutoMQ, Prometheus, and Nightingale Monitoring
### Deploy AutoMQ
Refer to the AutoMQ documentation: [Deploy Multi-Nodes Cluster on Linux▸](/automq/deployment/deploy-multi-nodes-cluster-on-linux). Before deployment, add the following configuration parameters to enable the Prometheus pull interface. After starting the AutoMQ cluster with these parameters, each node will additionally open an HTTP interface to fetch AutoMQ monitoring metrics. These metrics follow the format of Prometheus Metrics.
```bash theme={null}
bin/kafka-server-start.sh ...\
--override s3.telemetry.metrics.exporter.type=prometheus \
--override s3.metrics.exporter.prom.host=0.0.0.0 \
--override s3.metrics.exporter.prom.port=8890 \
....
```
Once AutoMQ monitoring metrics are enabled, metrics in Prometheus format can be pulled via HTTP from any node using the address: `http://{node_ip}:8890`. An example of the response results is as follows:
```text theme={null}
....
kafka_request_time_mean_milliseconds{otel_scope_name="io.opentelemetry.jmx",type="DescribeDelegationToken"} 0.0 1720520709290
kafka_request_time_mean_milliseconds{otel_scope_name="io.opentelemetry.jmx",type="CreatePartitions"} 0.0 1720520709290
...
```
For more information about the metrics, refer to the AutoMQ official documentation: [Prometheus Metrics▸](/automq/observability/prometheus-metrics).
### Deploying Prometheus
Prometheus can be deployed by downloading the binary package or using Docker. Below is an introduction to these two deployment methods.
#### Binary Deployment
For ease of use, you can create a new script and modify the Prometheus download version as needed. Then, execute the script to complete the deployment. First, create a new script:
```bash theme={null}
cd /home
vim install_prometheus.sh
# !!! Paste the Following Script Content and Save and Exit
# Grant Permissions
chmod +x install_prometheus.sh
# Execute the Script
./install_prometheus.sh
```
```bash theme={null}
version=2.45.3
filename=prometheus-${version}.linux-amd64
mkdir -p /opt/prometheus
wget https://github.com/prometheus/prometheus/releases/download/v${version}/${filename}.tar.gz
tar xf ${filename}.tar.gz
cp -far ${filename}/* /opt/prometheus/
# Config as a Service
cat </etc/systemd/system/prometheus.service
[Unit]
Description="prometheus"
Documentation=https://prometheus.io/
After=network.target
[Service]
Type=simple
ExecStart=/opt/prometheus/prometheus --config.file=/opt/prometheus/prometheus.yml --storage.tsdb.path=/opt/prometheus/data --web.enable-lifecycle --web.enable-remote-write-receiver
Restart=on-failure
SuccessExitStatus=0
LimitNOFILE=65536
StandardOutput=syslog
StandardError=syslog
SyslogIdentifier=prometheus
[Install]
WantedBy=multi-user.target
EOF
systemctl enable prometheus
systemctl restart prometheus
systemctl status prometheus
```
Subsequently, modify the Prometheus configuration file to **add a task to collect observability data from AutoMQ** and **restart** Prometheus by executing the following command:
```bash theme={null}
# Add the Following Content to the Configuration File:
vim /opt/prometheus/prometheus.yml
# Restart Prometheus
systemctl restart prometheus
```
**Refer to the following configuration file content**, please modify the `client_ip` to the AutoMQ observable data exposure address:
```yaml theme={null}
# My Global Config
global:
scrape_interval: 15s # Set the Scrape Interval to Every 15 Seconds. Default Is Every 1 Minute.
evaluation_interval: 15s # Evaluate Rules Every 15 Seconds. the Default Is Every 1 Minute.
scrape_configs:
# The Job Name Is Added as a Label `job=` to Any Timeseries Scraped from This Config.
- job_name: "prometheus"
static_configs:
- targets: ["localhost:9090"]
- job_name: "automq"
static_configs:
- targets: ["{client_ip}:8890"]
```
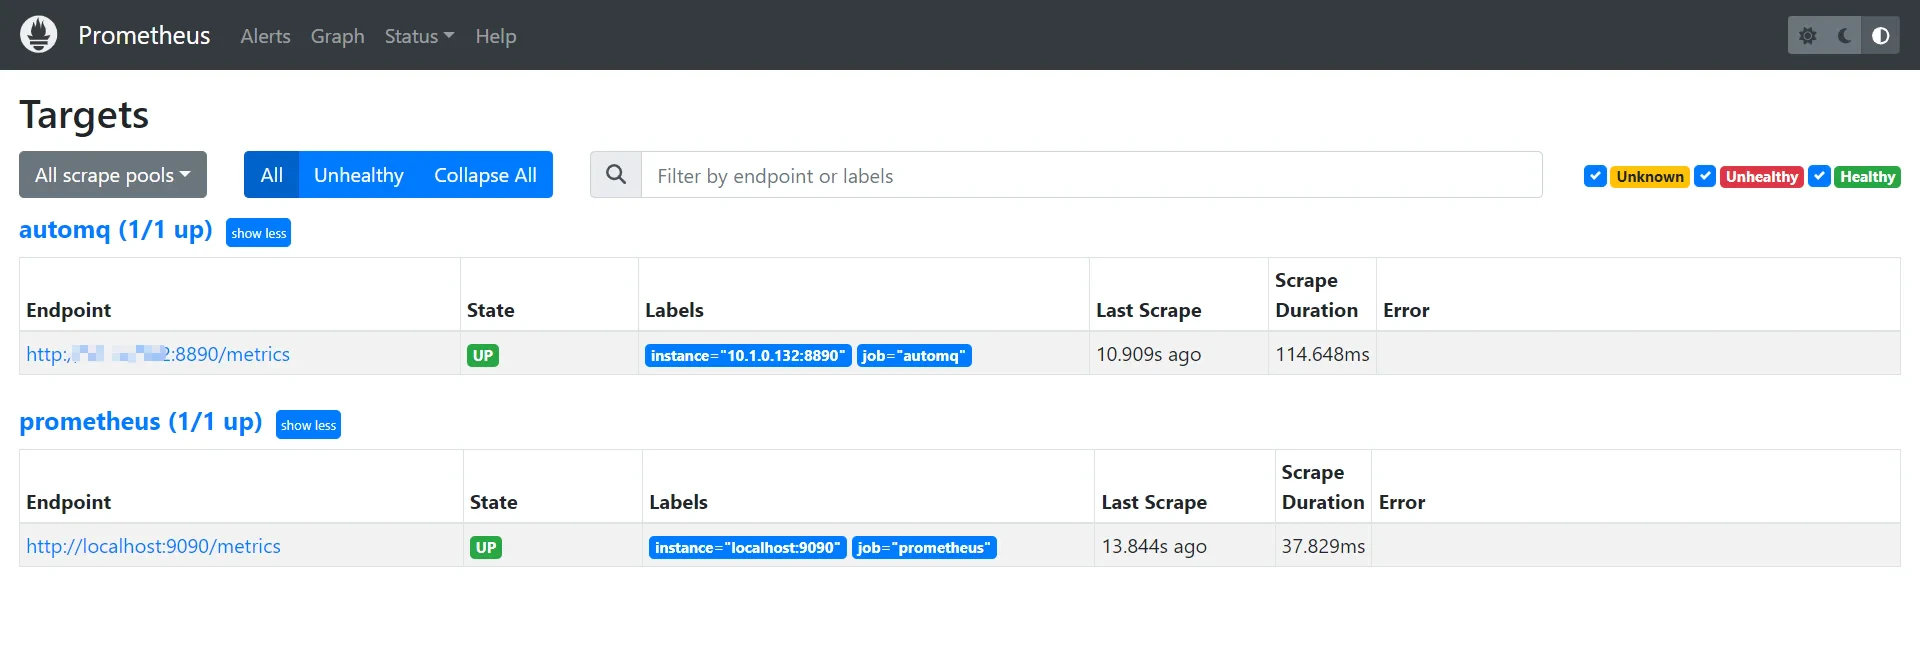
Once the deployment is completed, you can access Prometheus through a browser to determine if AutoMQ's Metrics data has been successfully collected by visiting `http://{client_ip}:9090/targets`:
## Prerequisites
To monitor the status of the cluster, you will need the following setup:
* Deploy an available AutoMQ node/cluster and open the Metrics collection port
* Deploy Nightingale monitoring and its dependencies
* Deploy [Prometheus](https://prometheus.io/docs/prometheus/latest/getting_started/) to collect Metrics data
## Deploy AutoMQ, Prometheus, and Nightingale Monitoring
### Deploy AutoMQ
Refer to the AutoMQ documentation: [Deploy Multi-Nodes Cluster on Linux▸](/automq/deployment/deploy-multi-nodes-cluster-on-linux). Before deployment, add the following configuration parameters to enable the Prometheus pull interface. After starting the AutoMQ cluster with these parameters, each node will additionally open an HTTP interface to fetch AutoMQ monitoring metrics. These metrics follow the format of Prometheus Metrics.
```bash theme={null}
bin/kafka-server-start.sh ...\
--override s3.telemetry.metrics.exporter.type=prometheus \
--override s3.metrics.exporter.prom.host=0.0.0.0 \
--override s3.metrics.exporter.prom.port=8890 \
....
```
Once AutoMQ monitoring metrics are enabled, metrics in Prometheus format can be pulled via HTTP from any node using the address: `http://{node_ip}:8890`. An example of the response results is as follows:
```text theme={null}
....
kafka_request_time_mean_milliseconds{otel_scope_name="io.opentelemetry.jmx",type="DescribeDelegationToken"} 0.0 1720520709290
kafka_request_time_mean_milliseconds{otel_scope_name="io.opentelemetry.jmx",type="CreatePartitions"} 0.0 1720520709290
...
```
For more information about the metrics, refer to the AutoMQ official documentation: [Prometheus Metrics▸](/automq/observability/prometheus-metrics).
### Deploying Prometheus
Prometheus can be deployed by downloading the binary package or using Docker. Below is an introduction to these two deployment methods.
#### Binary Deployment
For ease of use, you can create a new script and modify the Prometheus download version as needed. Then, execute the script to complete the deployment. First, create a new script:
```bash theme={null}
cd /home
vim install_prometheus.sh
# !!! Paste the Following Script Content and Save and Exit
# Grant Permissions
chmod +x install_prometheus.sh
# Execute the Script
./install_prometheus.sh
```
```bash theme={null}
version=2.45.3
filename=prometheus-${version}.linux-amd64
mkdir -p /opt/prometheus
wget https://github.com/prometheus/prometheus/releases/download/v${version}/${filename}.tar.gz
tar xf ${filename}.tar.gz
cp -far ${filename}/* /opt/prometheus/
# Config as a Service
cat </etc/systemd/system/prometheus.service
[Unit]
Description="prometheus"
Documentation=https://prometheus.io/
After=network.target
[Service]
Type=simple
ExecStart=/opt/prometheus/prometheus --config.file=/opt/prometheus/prometheus.yml --storage.tsdb.path=/opt/prometheus/data --web.enable-lifecycle --web.enable-remote-write-receiver
Restart=on-failure
SuccessExitStatus=0
LimitNOFILE=65536
StandardOutput=syslog
StandardError=syslog
SyslogIdentifier=prometheus
[Install]
WantedBy=multi-user.target
EOF
systemctl enable prometheus
systemctl restart prometheus
systemctl status prometheus
```
Subsequently, modify the Prometheus configuration file to **add a task to collect observability data from AutoMQ** and **restart** Prometheus by executing the following command:
```bash theme={null}
# Add the Following Content to the Configuration File:
vim /opt/prometheus/prometheus.yml
# Restart Prometheus
systemctl restart prometheus
```
**Refer to the following configuration file content**, please modify the `client_ip` to the AutoMQ observable data exposure address:
```yaml theme={null}
# My Global Config
global:
scrape_interval: 15s # Set the Scrape Interval to Every 15 Seconds. Default Is Every 1 Minute.
evaluation_interval: 15s # Evaluate Rules Every 15 Seconds. the Default Is Every 1 Minute.
scrape_configs:
# The Job Name Is Added as a Label `job=` to Any Timeseries Scraped from This Config.
- job_name: "prometheus"
static_configs:
- targets: ["localhost:9090"]
- job_name: "automq"
static_configs:
- targets: ["{client_ip}:8890"]
```
Once the deployment is completed, you can access Prometheus through a browser to determine if AutoMQ's Metrics data has been successfully collected by visiting `http://{client_ip}:9090/targets`:
 #### Docker Deployment
If you already have a running Prometheus Docker container, please execute the following command to remove the container:
```bash theme={null}
docker stop prometheus
docker rm prometheus
```
Create a new configuration file and mount it during Docker startup:
```bash theme={null}
mkdir -p /opt/prometheus
vim /opt/prometheus/prometheus.yml
# Refer to the Configuration Mentioned in the "Binary Deployment" Section Above for the Content
```
Start the Docker container:
```bash theme={null}
docker run -d \
--name=prometheus \
-p 9090:9090 \
-v /opt/prometheus/prometheus.yml:/etc/prometheus/prometheus.yml \
-m 500m \
prom/prometheus \
--config.file=/etc/prometheus/prometheus.yml \
--enable-feature=otlp-write-receiver \
--web.enable-remote-write-receiver
```
This will direct you to a Prometheus service that collects AutoMQ Metrics. For more information on integrating AutoMQ Metrics with Prometheus, refer to: [Integrating Metrics with Prometheus▸](/automq/observability/integrating-metrics-with-prometheus).
### Deploy Nightingale Monitoring
Nightingale monitoring can be deployed in the following three ways. For more detailed deployment instructions, refer to the [official documentation](https://flashcat.cloud/docs/content/flashcat-monitor/nightingale-v7/install/intro/) \[5]:
* Deploy using Docker compose
* Deploy using binary
* Helm Deployment
Next, I will proceed with the deployment using a binary method.
#### Download Nightingale
Select the appropriate version to download from the Nightingale [GitHub releases](https://github.com/ccfos/nightingale) \[6] page. The version used here is `v7.0.0-beta.14`. If you are on an amd architecture machine, you can directly execute the following command:
```bash theme={null}
cd /home
# Download
wget https://github.com/ccfos/nightingale/releases/download/v7.0.0-beta.14/n9e-v7.0.0-beta.14-linux-amd64.tar.gz
mkdir -p /home/flashcat
# Extract the Files to the /home/flashcat Folder
tar -xzf /home/n9e-v7.0.0-beta.14-linux-amd64.tar.gz -C /home/flashcat
# Navigate to the Home Directory
cd /home/flashcat
```
#### Configure the Dependency Environment
Nightingale depends on MySQL and Redis, so you need to install these environments beforehand. You can deploy them via Docker or by executing the commands as follows:
```bash theme={null}
# Install Mysql
yum -y install mariadb*
systemctl enable mariadb
systemctl restart mariadb
mysql -e "SET PASSWORD FOR 'root'@'localhost' = PASSWORD('1234');"
# Install Redis
yum install -y redis
systemctl enable redis
systemctl restart redis
```
Here, Redis is set to no password. Additionally, the MySQL database password is specified as `1234`. **If you need to change to another password**, you need to configure it in the Nightingale configuration file to ensure Nightingale can connect to your database. Modify the Nightingale configuration file:
```json theme={null}
vim /home/flashcat/etc/config.toml
Modify the username and password under [DB]:
[DB]
# Postgres: Host=%s Port=%s User=%s Dbname=%s Password=%s Sslmode=%s
# Postgres: DSN="host=127.0.0.1 Port=5432 User=root Dbname=n9e_v6 Password=1234 Sslmode=disable"
# Sqlite: DSN="/path/to/filename.db"
DSN = "{username}:{password}@tcp(127.0.0.1:3306)/n9e_v6?charset=utf8mb4&parseTime=True&loc=Local&allowNativePasswords=true"
# Enable Debug Mode or Not
```
#### Import Database Tables
Execute the following command:
```bash theme={null}
mysql -uroot -p1234 < n9e.sql
```
Use a database tool to check if the database tables were successfully imported:
```text theme={null}
> show databases;
+--------------------+
| Database |
+--------------------+
| n9e_v6 |
+--------------------+
> show tables;
+-----------------------+
| Tables_in_n9e_v6 |
+-----------------------+
| alert_aggr_view |
| alert_cur_event |
| alert_his_event |
| alert_mute |
| alert_rule |
| alert_subscribe |
| alerting_engines |
| board |
| board_busigroup |
| board_payload |
| builtin_cate |
| builtin_components |
| builtin_metrics |
······
```
#### Modify the Nightingale Configuration File
You need to modify the Nightingale configuration file to set up the Prometheus data source:
```json theme={null}
vim /home/flashcat/etc/config.toml
# Modify the [[Pushgw.Writers]] Section to
[[Pushgw.Writers]]
# Url = "http://127.0.0.1:8480/insert/0/prometheus/api/v1/write"
Url = "http://{client_ip}:9090/api/v1/write"
```
#### Start Nightingale
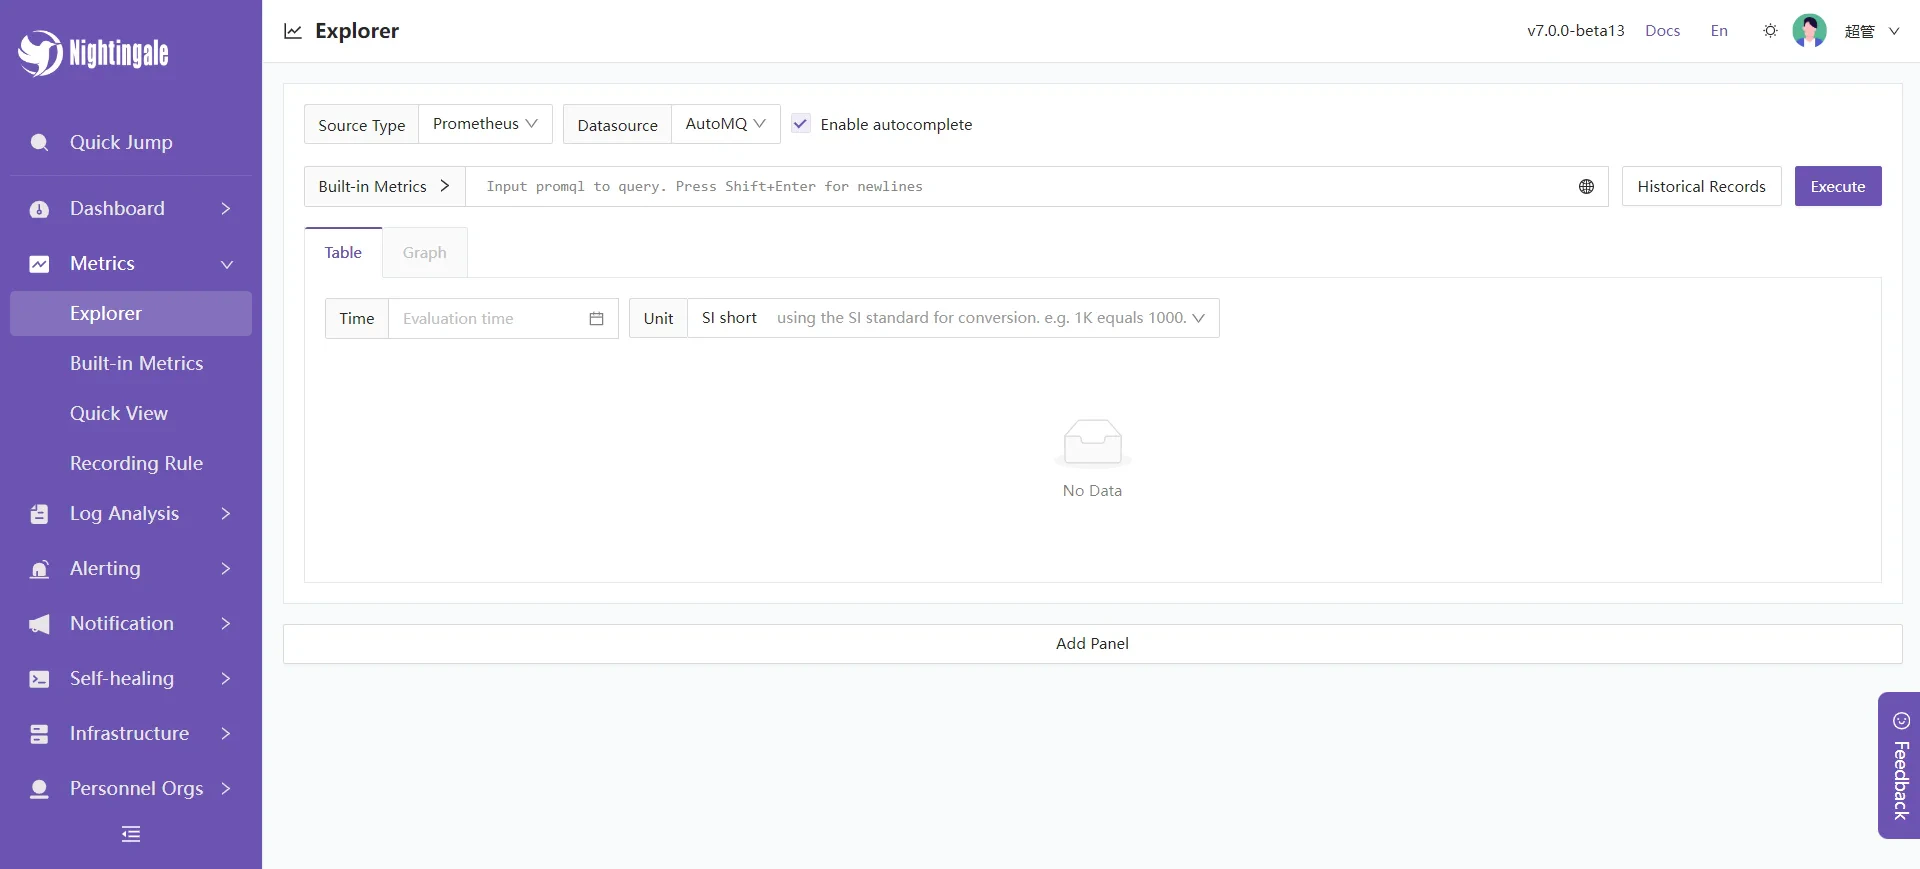
In the root directory of Nightingale `/home/flashcat`, execute: `./n9e`. After a successful start, you can access it in your browser at `http://{client_ip}:17000`, with the default login username and password being:
* Username: `root`yaml
* Password: `root.2020`bash
#### Docker Deployment
If you already have a running Prometheus Docker container, please execute the following command to remove the container:
```bash theme={null}
docker stop prometheus
docker rm prometheus
```
Create a new configuration file and mount it during Docker startup:
```bash theme={null}
mkdir -p /opt/prometheus
vim /opt/prometheus/prometheus.yml
# Refer to the Configuration Mentioned in the "Binary Deployment" Section Above for the Content
```
Start the Docker container:
```bash theme={null}
docker run -d \
--name=prometheus \
-p 9090:9090 \
-v /opt/prometheus/prometheus.yml:/etc/prometheus/prometheus.yml \
-m 500m \
prom/prometheus \
--config.file=/etc/prometheus/prometheus.yml \
--enable-feature=otlp-write-receiver \
--web.enable-remote-write-receiver
```
This will direct you to a Prometheus service that collects AutoMQ Metrics. For more information on integrating AutoMQ Metrics with Prometheus, refer to: [Integrating Metrics with Prometheus▸](/automq/observability/integrating-metrics-with-prometheus).
### Deploy Nightingale Monitoring
Nightingale monitoring can be deployed in the following three ways. For more detailed deployment instructions, refer to the [official documentation](https://flashcat.cloud/docs/content/flashcat-monitor/nightingale-v7/install/intro/) \[5]:
* Deploy using Docker compose
* Deploy using binary
* Helm Deployment
Next, I will proceed with the deployment using a binary method.
#### Download Nightingale
Select the appropriate version to download from the Nightingale [GitHub releases](https://github.com/ccfos/nightingale) \[6] page. The version used here is `v7.0.0-beta.14`. If you are on an amd architecture machine, you can directly execute the following command:
```bash theme={null}
cd /home
# Download
wget https://github.com/ccfos/nightingale/releases/download/v7.0.0-beta.14/n9e-v7.0.0-beta.14-linux-amd64.tar.gz
mkdir -p /home/flashcat
# Extract the Files to the /home/flashcat Folder
tar -xzf /home/n9e-v7.0.0-beta.14-linux-amd64.tar.gz -C /home/flashcat
# Navigate to the Home Directory
cd /home/flashcat
```
#### Configure the Dependency Environment
Nightingale depends on MySQL and Redis, so you need to install these environments beforehand. You can deploy them via Docker or by executing the commands as follows:
```bash theme={null}
# Install Mysql
yum -y install mariadb*
systemctl enable mariadb
systemctl restart mariadb
mysql -e "SET PASSWORD FOR 'root'@'localhost' = PASSWORD('1234');"
# Install Redis
yum install -y redis
systemctl enable redis
systemctl restart redis
```
Here, Redis is set to no password. Additionally, the MySQL database password is specified as `1234`. **If you need to change to another password**, you need to configure it in the Nightingale configuration file to ensure Nightingale can connect to your database. Modify the Nightingale configuration file:
```json theme={null}
vim /home/flashcat/etc/config.toml
Modify the username and password under [DB]:
[DB]
# Postgres: Host=%s Port=%s User=%s Dbname=%s Password=%s Sslmode=%s
# Postgres: DSN="host=127.0.0.1 Port=5432 User=root Dbname=n9e_v6 Password=1234 Sslmode=disable"
# Sqlite: DSN="/path/to/filename.db"
DSN = "{username}:{password}@tcp(127.0.0.1:3306)/n9e_v6?charset=utf8mb4&parseTime=True&loc=Local&allowNativePasswords=true"
# Enable Debug Mode or Not
```
#### Import Database Tables
Execute the following command:
```bash theme={null}
mysql -uroot -p1234 < n9e.sql
```
Use a database tool to check if the database tables were successfully imported:
```text theme={null}
> show databases;
+--------------------+
| Database |
+--------------------+
| n9e_v6 |
+--------------------+
> show tables;
+-----------------------+
| Tables_in_n9e_v6 |
+-----------------------+
| alert_aggr_view |
| alert_cur_event |
| alert_his_event |
| alert_mute |
| alert_rule |
| alert_subscribe |
| alerting_engines |
| board |
| board_busigroup |
| board_payload |
| builtin_cate |
| builtin_components |
| builtin_metrics |
······
```
#### Modify the Nightingale Configuration File
You need to modify the Nightingale configuration file to set up the Prometheus data source:
```json theme={null}
vim /home/flashcat/etc/config.toml
# Modify the [[Pushgw.Writers]] Section to
[[Pushgw.Writers]]
# Url = "http://127.0.0.1:8480/insert/0/prometheus/api/v1/write"
Url = "http://{client_ip}:9090/api/v1/write"
```
#### Start Nightingale
In the root directory of Nightingale `/home/flashcat`, execute: `./n9e`. After a successful start, you can access it in your browser at `http://{client_ip}:17000`, with the default login username and password being:
* Username: `root`yaml
* Password: `root.2020`bash
 #### Integrate Prometheus Data Source
Left sidebar Integration -> Data Source -> Prometheus.
#### Integrate Prometheus Data Source
Left sidebar Integration -> Data Source -> Prometheus.
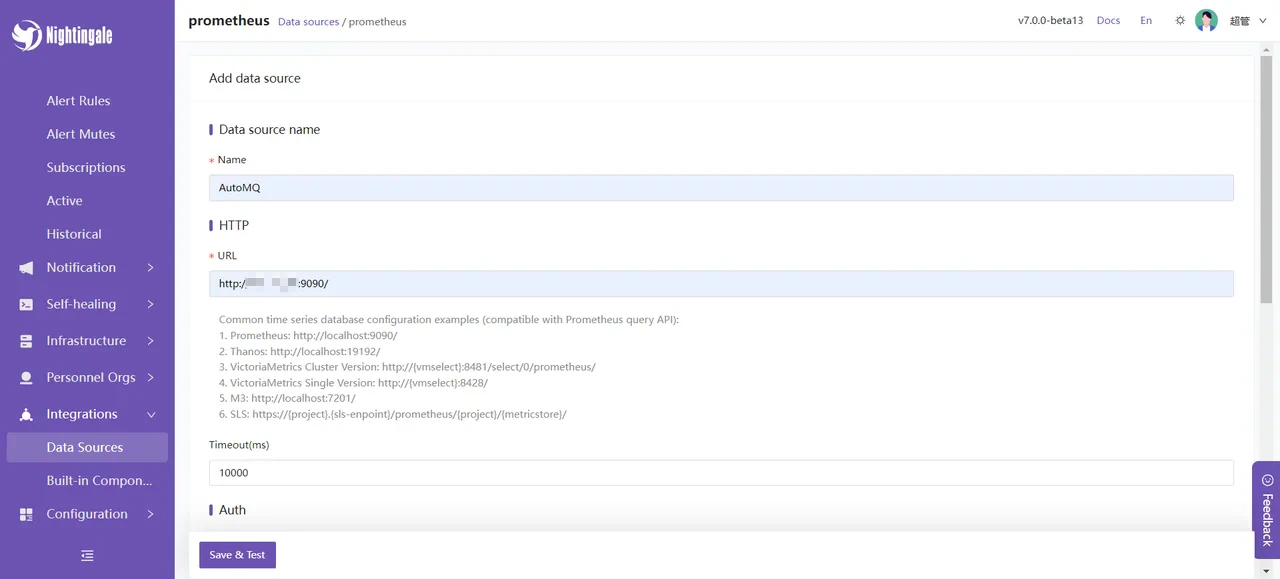 At this point, the Nightingale monitoring deployment is complete.
## Nightingale Monitoring AutoMQ Cluster Status
Next, we will introduce some of the features provided by Nightingale monitoring to help you better understand the available features integrated with AutoMQ.
### Instant Query
Select built-in AutoMQ metrics:
At this point, the Nightingale monitoring deployment is complete.
## Nightingale Monitoring AutoMQ Cluster Status
Next, we will introduce some of the features provided by Nightingale monitoring to help you better understand the available features integrated with AutoMQ.
### Instant Query
Select built-in AutoMQ metrics:
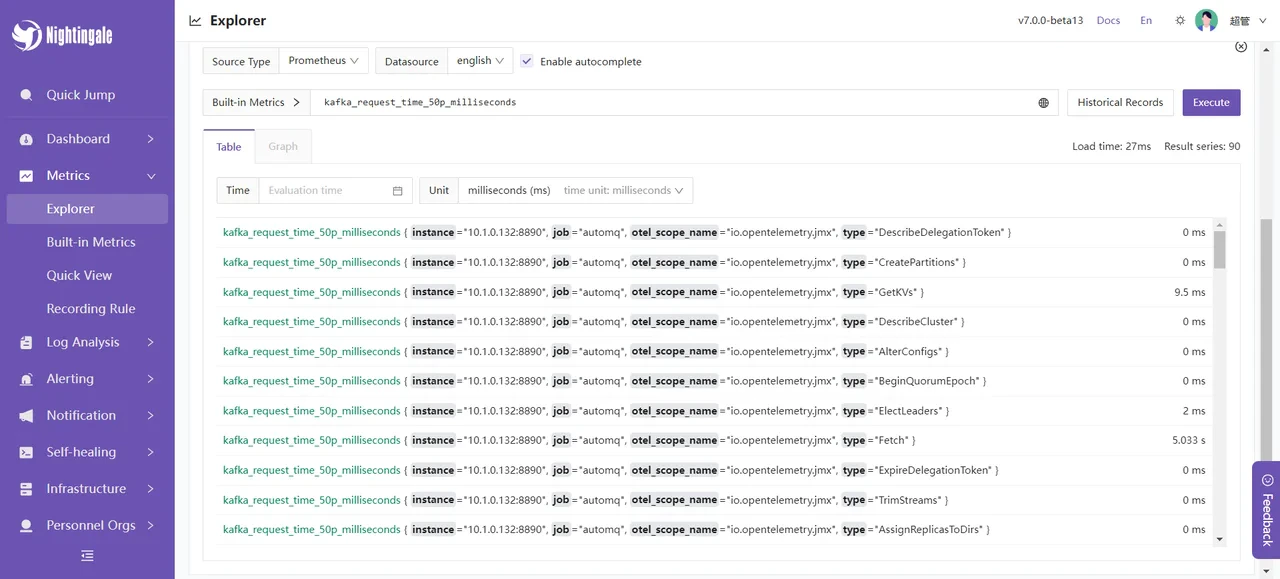
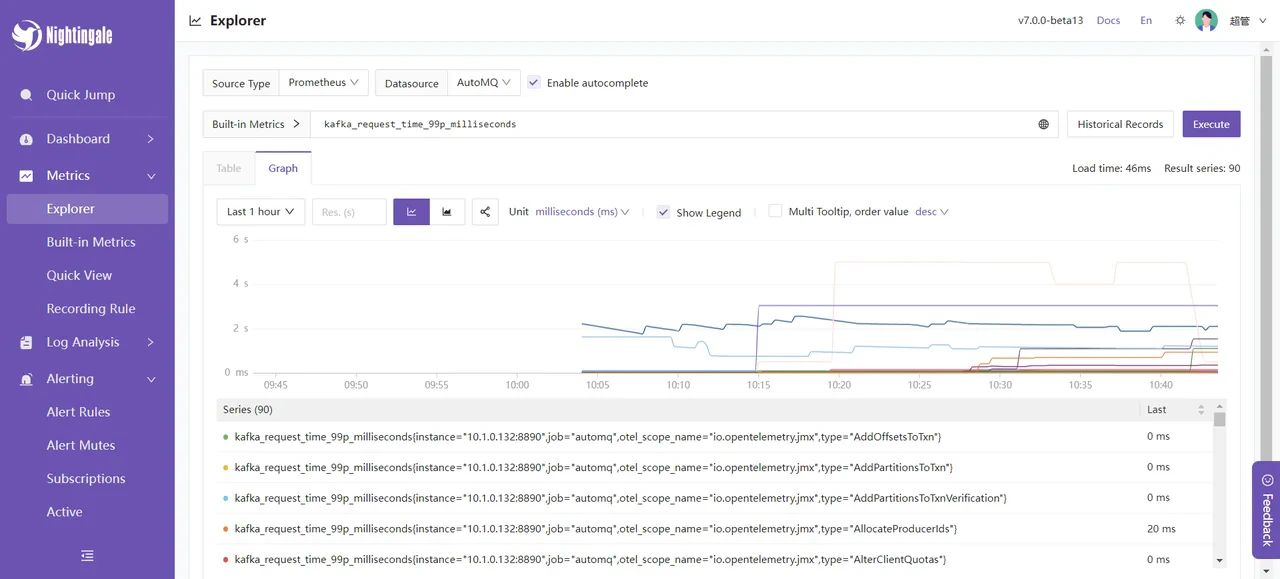
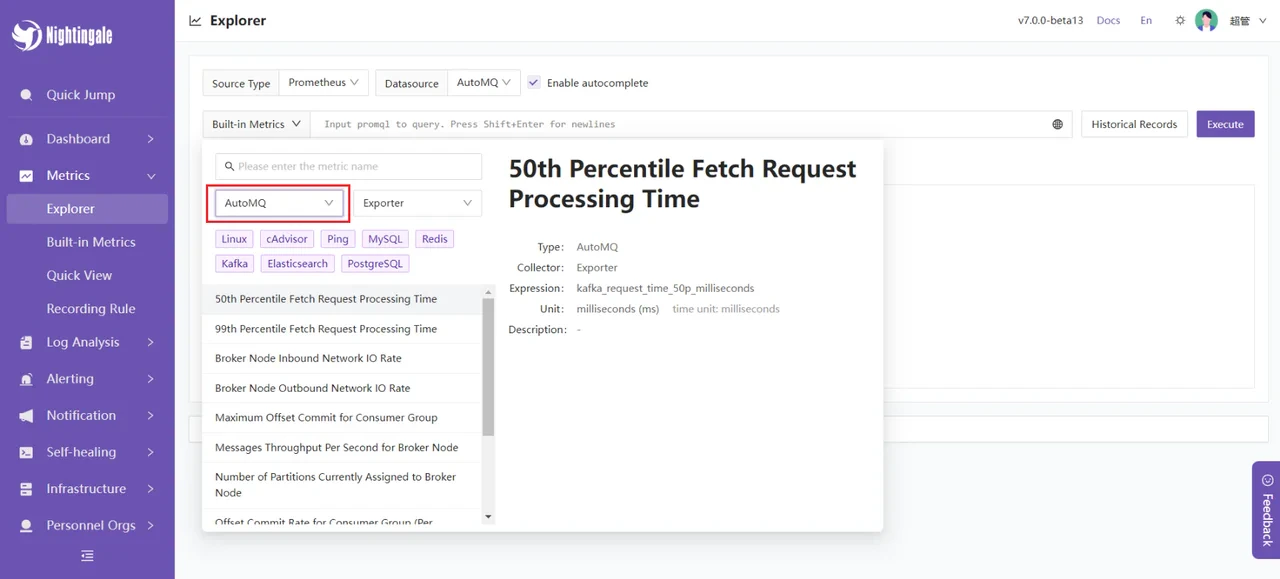 You can try querying some data, such as the average fetch request processing time
`kafka_request_time_50p_milliseconds`:
You can try querying some data, such as the average fetch request processing time
`kafka_request_time_50p_milliseconds`:
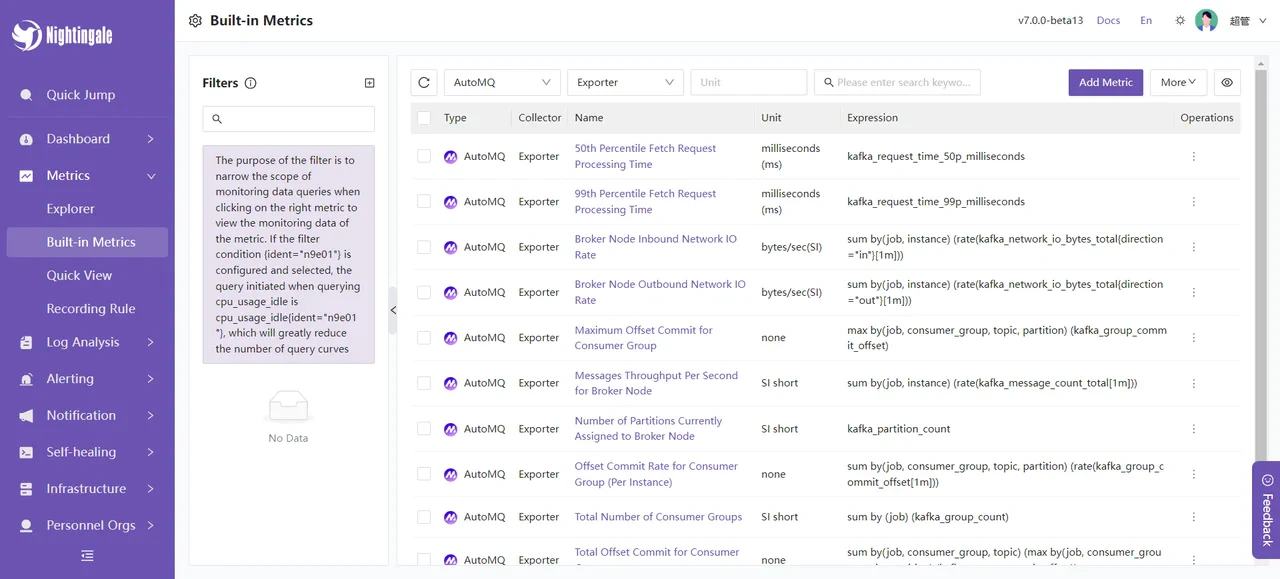
 Additionally, you can customize some metrics and use expressions to aggregate these metrics:
 ### Alerting Feature
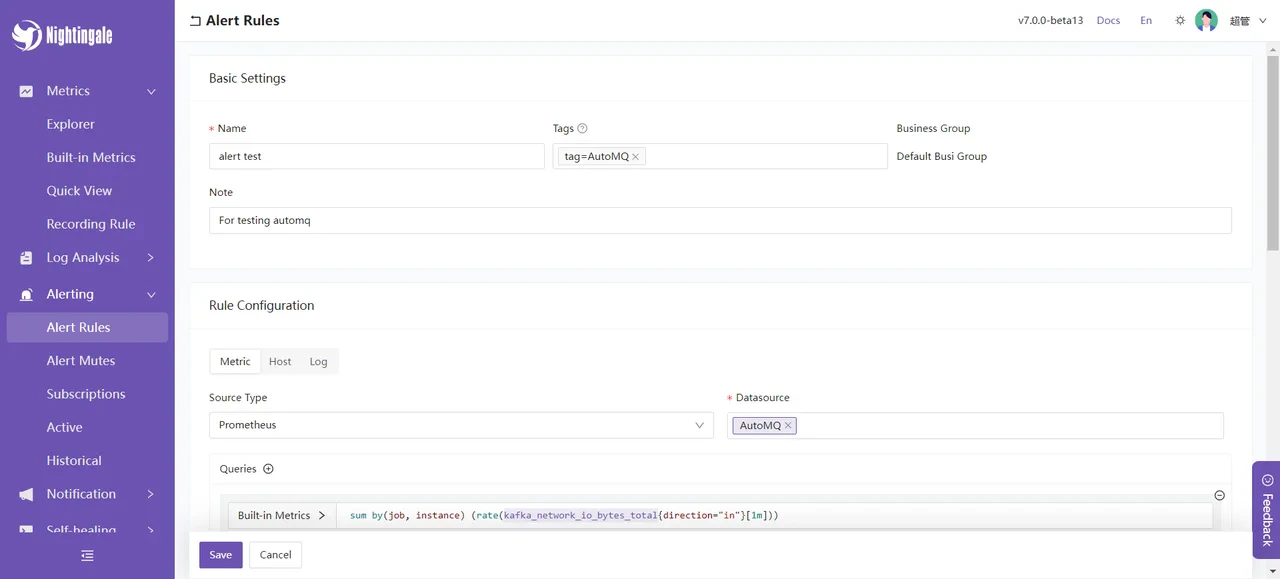
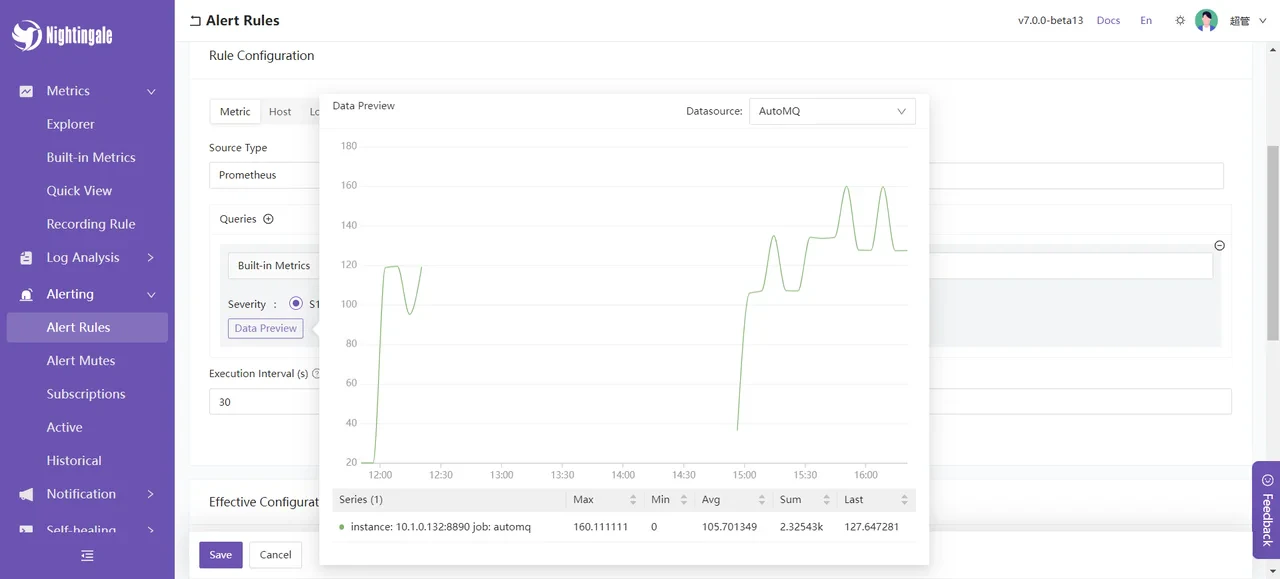
Select from the left sidebar Alerts -> Alert Rules -> Create New Rule. For example, you can set an alert for `kafka_network_io_bytes_total`, which measures the total number of bytes sent or received by Kafka Broker nodes over the network. By setting an expression for this metric, you can calculate the inbound network I/O rate for Kafka Broker nodes. The expression is:
```text theme={null}
sum by(job, instance) (rate(kafka_network_io_bytes_total{direction="in"}[1m]))
```
Setting Alert Rules:
### Alerting Feature
Select from the left sidebar Alerts -> Alert Rules -> Create New Rule. For example, you can set an alert for `kafka_network_io_bytes_total`, which measures the total number of bytes sent or received by Kafka Broker nodes over the network. By setting an expression for this metric, you can calculate the inbound network I/O rate for Kafka Broker nodes. The expression is:
```text theme={null}
sum by(job, instance) (rate(kafka_network_io_bytes_total{direction="in"}[1m]))
```
Setting Alert Rules:
 Data preview:
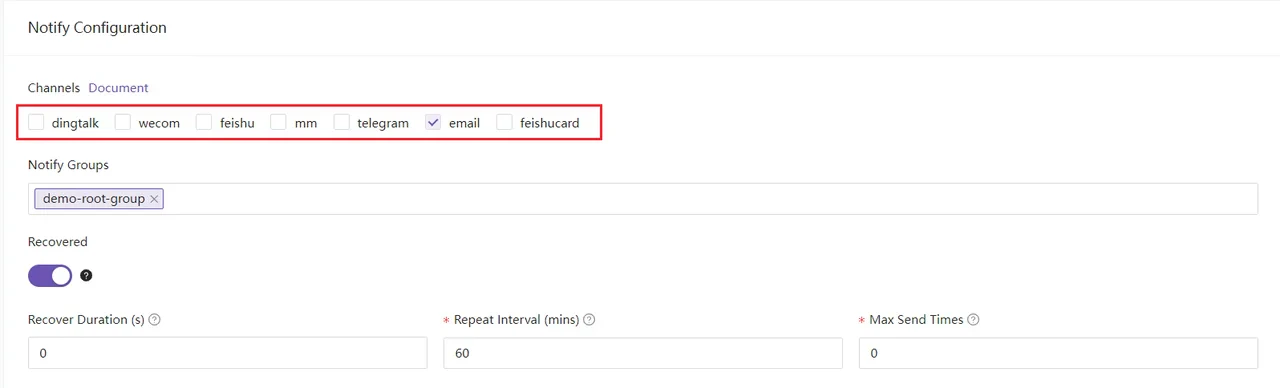
 You can also configure groups to be notified when an alert occurs:
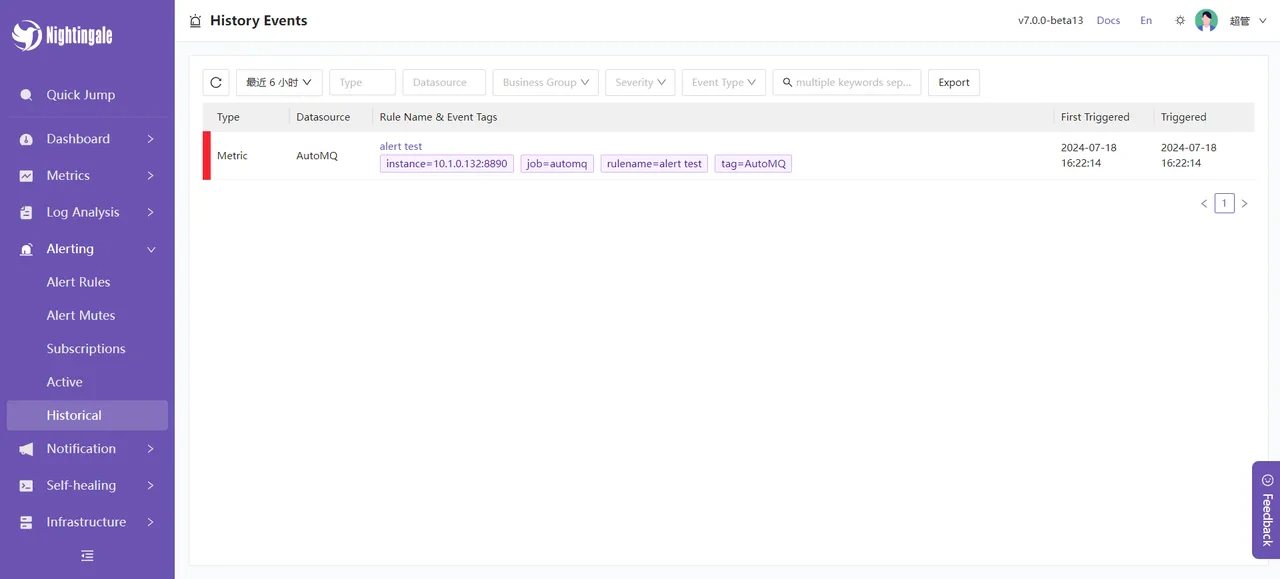
 After creating the alert, you can simulate a high-concurrency message processing scenario: a total of `2500000` messages are sent to AutoMQ nodes within a short period. The method used is sending messages through the Kafka SDK, with a total of 50 Topics, each Topic receiving 500 messages, repeated 100 times. An example is as follows:
```bash theme={null}
import org.apache.kafka.clients.admin.AdminClient;
import org.apache.kafka.clients.admin.AdminClientConfig;
import org.apache.kafka.clients.admin.NewTopic;
import org.apache.kafka.clients.producer.KafkaProducer;
import org.apache.kafka.clients.producer.ProducerConfig;
import org.apache.kafka.clients.producer.ProducerRecord;
import org.apache.kafka.clients.producer.RecordMetadata;
import org.apache.kafka.common.serialization.StringSerializer;
import java.util.ArrayList;
import java.util.List;
import java.util.Properties;
import java.util.concurrent.ExecutionException;
public class KafkaTest {
private static final String BOOTSTRAP_SERVERS = "http://{}:9092"; // your automq broker ip
private static final int NUM_TOPICS = 50;
private static final int NUM_MESSAGES = 500;
public static void main(String[] args) throws Exception {
KafkaTest test = new KafkaTest();
// test.createTopics(); // create 50 topics
for(int i = 0; i < 100; i++){
test.sendMessages(); // 25,000 messages will be sent each time, and 500 messages will be sent to each of 50 topics.
}
}
public void createTopics() {
Properties props = new Properties();
props.put(AdminClientConfig.BOOTSTRAP_SERVERS_CONFIG, BOOTSTRAP_SERVERS);
try (AdminClient adminClient = AdminClient.create(props)) {
List topics = new ArrayList<>();
for (int i = 1; i <= NUM_TOPICS; i++) {
topics.add(new NewTopic("Topic-" + i, 1, (short) 1));
}
adminClient.createTopics(topics).all().get();
System.out.println("Topics created successfully");
} catch (InterruptedException | ExecutionException e) {
e.printStackTrace();
}
}
public void sendMessages() {
Properties props = new Properties();
props.put(ProducerConfig.BOOTSTRAP_SERVERS_CONFIG, BOOTSTRAP_SERVERS);
props.put(ProducerConfig.KEY_SERIALIZER_CLASS_CONFIG, StringSerializer.class.getName());
props.put(ProducerConfig.VALUE_SERIALIZER_CLASS_CONFIG, StringSerializer.class.getName());
try (KafkaProducer producer = new KafkaProducer<>(props)) {
for (int i = 1; i <= NUM_TOPICS; i++) {
String topic = "Topic-" + i;
for (int j = 1; j <= NUM_MESSAGES; j++) {
String key = "key-" + j;
String value = "{\"userId\": " + j + ", \"action\": \"visit\", \"timestamp\": " + System.currentTimeMillis() + "}";
ProducerRecord record = new ProducerRecord<>(topic, key, value);
producer.send(record, (RecordMetadata metadata, Exception exception) -> {
if (exception == null) {
System.out.printf("Sent message to topic %s partition %d with offset %d%n", metadata.topic(), metadata.partition(), metadata.offset());
} else {
exception.printStackTrace();
}
});
}
}
System.out.println("Messages sent successfully");
}
}
}
```
You can then see the alarm information in the Nightingale console:
After creating the alert, you can simulate a high-concurrency message processing scenario: a total of `2500000` messages are sent to AutoMQ nodes within a short period. The method used is sending messages through the Kafka SDK, with a total of 50 Topics, each Topic receiving 500 messages, repeated 100 times. An example is as follows:
```bash theme={null}
import org.apache.kafka.clients.admin.AdminClient;
import org.apache.kafka.clients.admin.AdminClientConfig;
import org.apache.kafka.clients.admin.NewTopic;
import org.apache.kafka.clients.producer.KafkaProducer;
import org.apache.kafka.clients.producer.ProducerConfig;
import org.apache.kafka.clients.producer.ProducerRecord;
import org.apache.kafka.clients.producer.RecordMetadata;
import org.apache.kafka.common.serialization.StringSerializer;
import java.util.ArrayList;
import java.util.List;
import java.util.Properties;
import java.util.concurrent.ExecutionException;
public class KafkaTest {
private static final String BOOTSTRAP_SERVERS = "http://{}:9092"; // your automq broker ip
private static final int NUM_TOPICS = 50;
private static final int NUM_MESSAGES = 500;
public static void main(String[] args) throws Exception {
KafkaTest test = new KafkaTest();
// test.createTopics(); // create 50 topics
for(int i = 0; i < 100; i++){
test.sendMessages(); // 25,000 messages will be sent each time, and 500 messages will be sent to each of 50 topics.
}
}
public void createTopics() {
Properties props = new Properties();
props.put(AdminClientConfig.BOOTSTRAP_SERVERS_CONFIG, BOOTSTRAP_SERVERS);
try (AdminClient adminClient = AdminClient.create(props)) {
List topics = new ArrayList<>();
for (int i = 1; i <= NUM_TOPICS; i++) {
topics.add(new NewTopic("Topic-" + i, 1, (short) 1));
}
adminClient.createTopics(topics).all().get();
System.out.println("Topics created successfully");
} catch (InterruptedException | ExecutionException e) {
e.printStackTrace();
}
}
public void sendMessages() {
Properties props = new Properties();
props.put(ProducerConfig.BOOTSTRAP_SERVERS_CONFIG, BOOTSTRAP_SERVERS);
props.put(ProducerConfig.KEY_SERIALIZER_CLASS_CONFIG, StringSerializer.class.getName());
props.put(ProducerConfig.VALUE_SERIALIZER_CLASS_CONFIG, StringSerializer.class.getName());
try (KafkaProducer producer = new KafkaProducer<>(props)) {
for (int i = 1; i <= NUM_TOPICS; i++) {
String topic = "Topic-" + i;
for (int j = 1; j <= NUM_MESSAGES; j++) {
String key = "key-" + j;
String value = "{\"userId\": " + j + ", \"action\": \"visit\", \"timestamp\": " + System.currentTimeMillis() + "}";
ProducerRecord record = new ProducerRecord<>(topic, key, value);
producer.send(record, (RecordMetadata metadata, Exception exception) -> {
if (exception == null) {
System.out.printf("Sent message to topic %s partition %d with offset %d%n", metadata.topic(), metadata.partition(), metadata.offset());
} else {
exception.printStackTrace();
}
});
}
}
System.out.println("Messages sent successfully");
}
}
}
```
You can then see the alarm information in the Nightingale console:
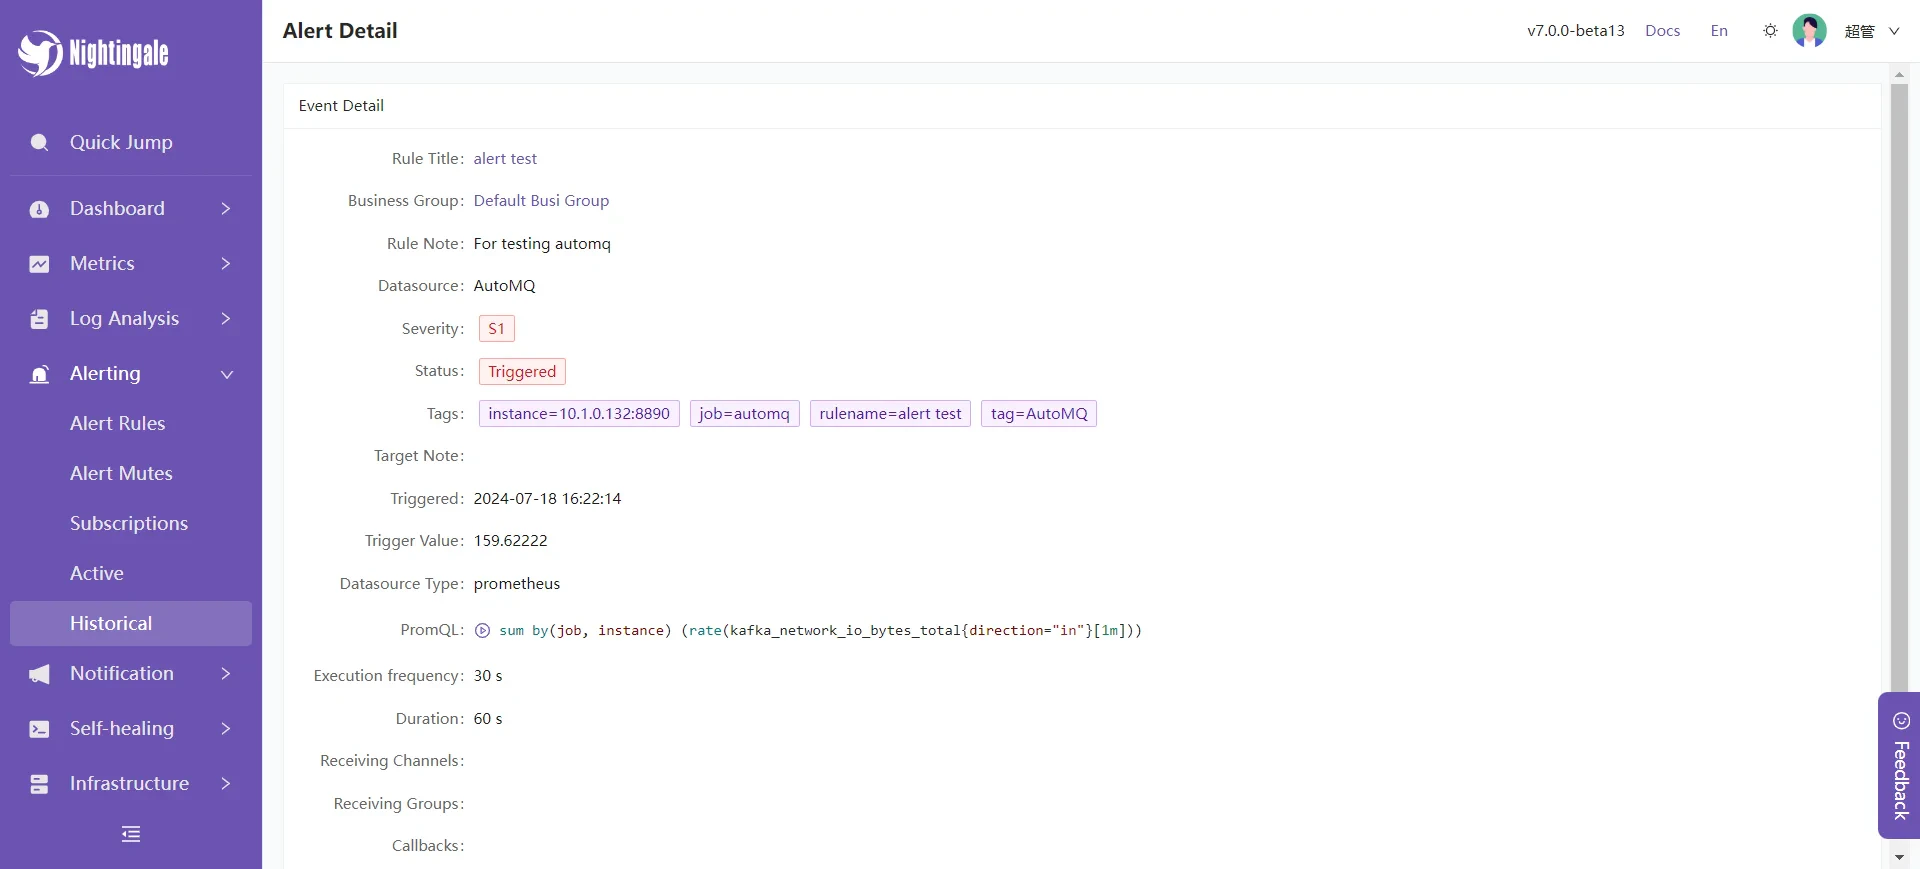
 Alert Details:
 ### Dashboard
First, you can use the known metrics to create your own dashboard. Below is an example of a statistical dashboard for AutoMQ message request processing time, total message count, and network IO bits:
### Dashboard
First, you can use the known metrics to create your own dashboard. Below is an example of a statistical dashboard for AutoMQ message request processing time, total message count, and network IO bits:
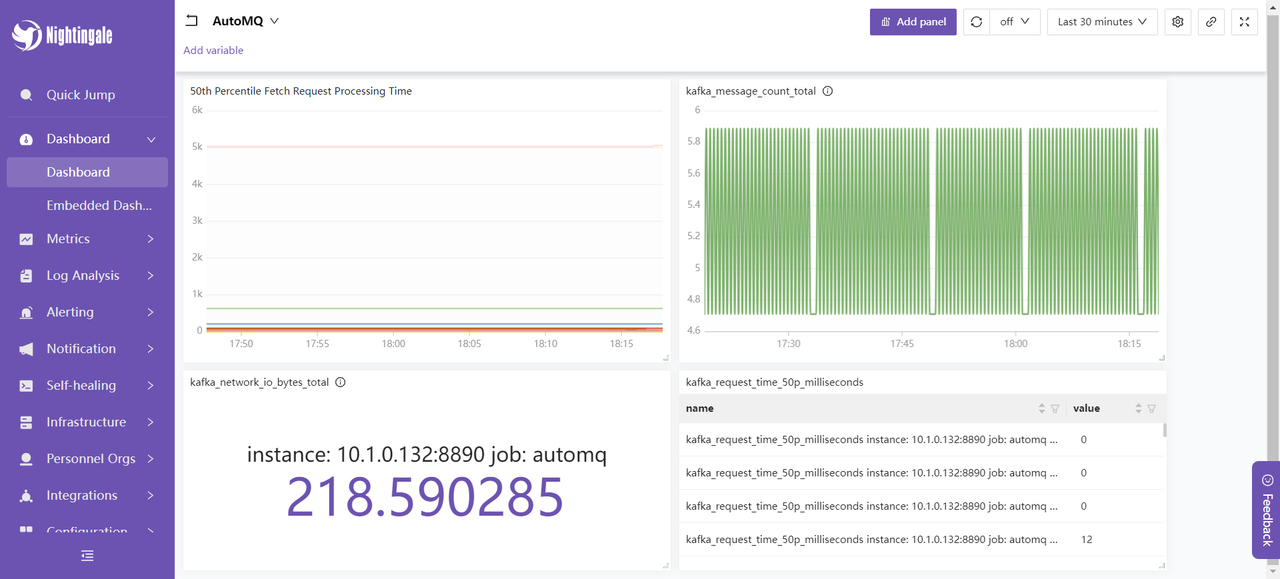 Additionally, you can use the built-in dashboards provided by the official source. Left sidebar -> Aggregate -> Template Center:
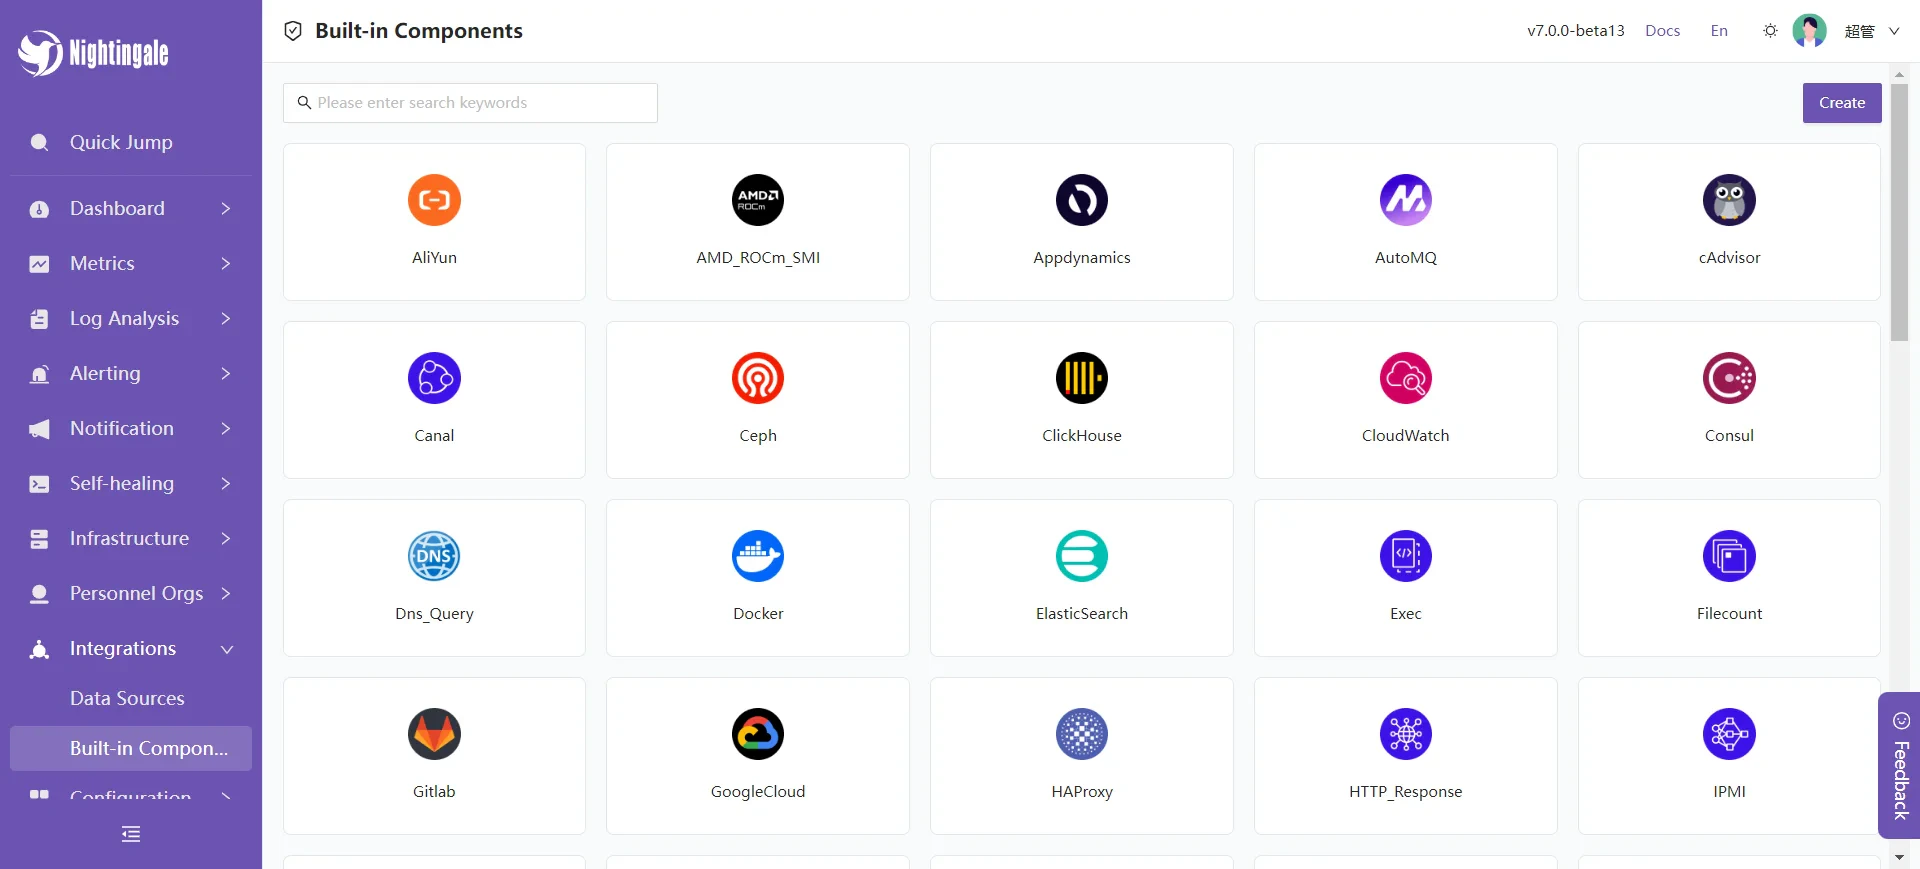 Choosing AutoMQ, you will see several DashBoards available:
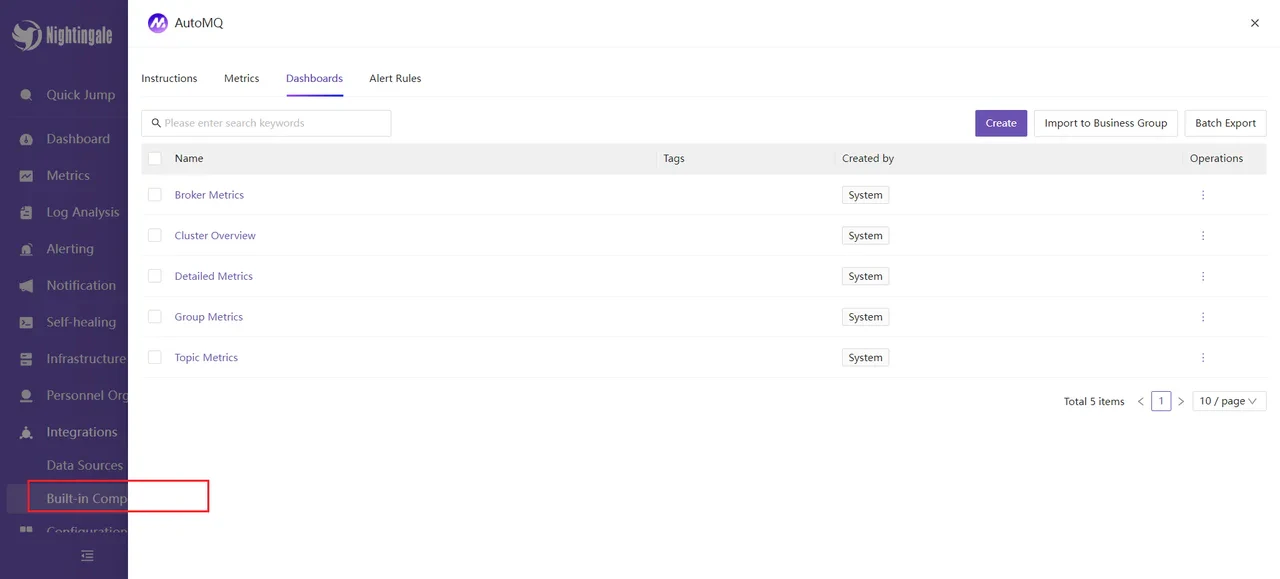 Select the Topic Metrics dashboard, and the content is displayed as follows:
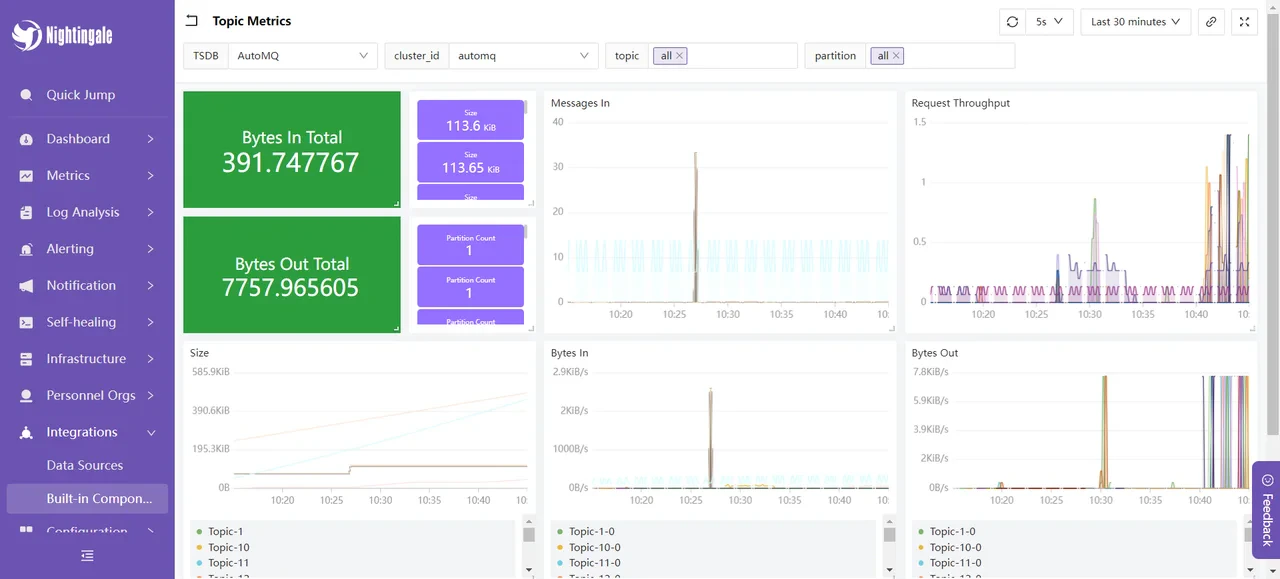 This dashboard shows the message input and output utilization, message input and request rates, and message sizes of the AutoMQ cluster over a recent period. These metrics are used to monitor and optimize the performance and stability of the AutoMQ cluster: By assessing the message input and output utilization, you can evaluate the load on producers and consumers, ensuring the cluster can handle the message flow properly. The message input rate is used for real-time monitoring of the rate at which producers send messages, identifying potential bottlenecks or sudden spikes in traffic. The request rate helps understand the frequency of client requests, optimizing resource allocation and processing capabilities. The message size metric analyzes the average size of messages to adjust configurations for optimizing storage and network transmission efficiency. Monitoring these metrics allows you to detect and resolve performance issues promptly, ensuring the efficient and stable operation of the AutoMQ cluster.
The integration process of FlashCat is now complete. For additional usage options, please refer to Nightingale's [official documentation](https://flashcat.cloud/docs/content/flashcat-monitor/nightingale-v7/overview/) \[7] to explore and experience further.
## Summary
This article elaborates on how to comprehensively monitor an AutoMQ cluster using the Nightingale monitoring system. Starting with the basic concepts of AutoMQ and Nightingale, it gradually explains how to deploy AutoMQ, Prometheus, and Nightingale, and configure monitoring and alarm rules. Through this integration, enterprises can monitor the operational status of the AutoMQ cluster in real-time, promptly identify and resolve potential issues, optimize system performance, and ensure business continuity and stability. The Nightingale monitoring system, with its powerful data collection capabilities, flexible alerting mechanisms, and rich visualization features, becomes an ideal choice for enterprises to monitor complex distributed systems. We hope this article provides valuable reference for your practical application, helping to make your system operations more efficient and stable.
## References
\[1] AutoMQ: [https://www.automq.com/](https://www.automq.com/)
\[2] Nightingale Monitoring: [https://flashcat.cloud/docs/content/flashcat-monitor/nightingale-v7/introduction/](https://flashcat.cloud/docs/content/flashcat-monitor/nightingale-v7/introduction/)
\[3] Nightingale Architecture: [https://flashcat.cloud/docs/content/flashcat-monitor/nightingale-v7/introduction/](https://flashcat.cloud/docs/content/flashcat-monitor/nightingale-v7/introduction/)
\[4] Prometheus: [https://prometheus.io/docs/prometheus/latest/getting\_started/](https://prometheus.io/docs/prometheus/latest/getting_started/)
\[5] Deployment Instructions: [https://flashcat.cloud/docs/content/flashcat-monitor/nightingale-v7/install/intro/](https://flashcat.cloud/docs/content/flashcat-monitor/nightingale-v7/install/intro/)
\[6] Nightingale GitHub releases: [https://github.com/ccfos/nightingale](https://github.com/ccfos/nightingale)
\[7] Nightingale Official Documentation: [https://flashcat.cloud/docs/content/flashcat-monitor/nightingale-v7/overview/](https://flashcat.cloud/docs/content/flashcat-monitor/nightingale-v7/overview/)
This dashboard shows the message input and output utilization, message input and request rates, and message sizes of the AutoMQ cluster over a recent period. These metrics are used to monitor and optimize the performance and stability of the AutoMQ cluster: By assessing the message input and output utilization, you can evaluate the load on producers and consumers, ensuring the cluster can handle the message flow properly. The message input rate is used for real-time monitoring of the rate at which producers send messages, identifying potential bottlenecks or sudden spikes in traffic. The request rate helps understand the frequency of client requests, optimizing resource allocation and processing capabilities. The message size metric analyzes the average size of messages to adjust configurations for optimizing storage and network transmission efficiency. Monitoring these metrics allows you to detect and resolve performance issues promptly, ensuring the efficient and stable operation of the AutoMQ cluster.
The integration process of FlashCat is now complete. For additional usage options, please refer to Nightingale's [official documentation](https://flashcat.cloud/docs/content/flashcat-monitor/nightingale-v7/overview/) \[7] to explore and experience further.
## Summary
This article elaborates on how to comprehensively monitor an AutoMQ cluster using the Nightingale monitoring system. Starting with the basic concepts of AutoMQ and Nightingale, it gradually explains how to deploy AutoMQ, Prometheus, and Nightingale, and configure monitoring and alarm rules. Through this integration, enterprises can monitor the operational status of the AutoMQ cluster in real-time, promptly identify and resolve potential issues, optimize system performance, and ensure business continuity and stability. The Nightingale monitoring system, with its powerful data collection capabilities, flexible alerting mechanisms, and rich visualization features, becomes an ideal choice for enterprises to monitor complex distributed systems. We hope this article provides valuable reference for your practical application, helping to make your system operations more efficient and stable.
## References
\[1] AutoMQ: [https://www.automq.com/](https://www.automq.com/)
\[2] Nightingale Monitoring: [https://flashcat.cloud/docs/content/flashcat-monitor/nightingale-v7/introduction/](https://flashcat.cloud/docs/content/flashcat-monitor/nightingale-v7/introduction/)
\[3] Nightingale Architecture: [https://flashcat.cloud/docs/content/flashcat-monitor/nightingale-v7/introduction/](https://flashcat.cloud/docs/content/flashcat-monitor/nightingale-v7/introduction/)
\[4] Prometheus: [https://prometheus.io/docs/prometheus/latest/getting\_started/](https://prometheus.io/docs/prometheus/latest/getting_started/)
\[5] Deployment Instructions: [https://flashcat.cloud/docs/content/flashcat-monitor/nightingale-v7/install/intro/](https://flashcat.cloud/docs/content/flashcat-monitor/nightingale-v7/install/intro/)
\[6] Nightingale GitHub releases: [https://github.com/ccfos/nightingale](https://github.com/ccfos/nightingale)
\[7] Nightingale Official Documentation: [https://flashcat.cloud/docs/content/flashcat-monitor/nightingale-v7/overview/](https://flashcat.cloud/docs/content/flashcat-monitor/nightingale-v7/overview/)