> ## Documentation Index
> Fetch the complete documentation index at: https://docs.automq.com/llms.txt
> Use this file to discover all available pages before exploring further.
# 仪表盘配置
> Optimize AutoMQ's Kafka-compatible monitoring with Grafana dashboards. Get performance insights on clusters, brokers, topics, and groups for peak efficiency.
AutoMQ 团队基于生产环境的使用场景,配置了一系列Grafana 大盘模板。用户将指标导出到 Prometheus 后,可以导入 Grafana 大盘模板,并将 Grafana 数据源配置为对应的 Prometheus,即可开始监测 AutoMQ。
您可以通过[填写表单](https://www.automq.com/contact)联系 AutoMQ 团队获取下方展示的一系列 Grafana 大盘模板。
### 集群概览
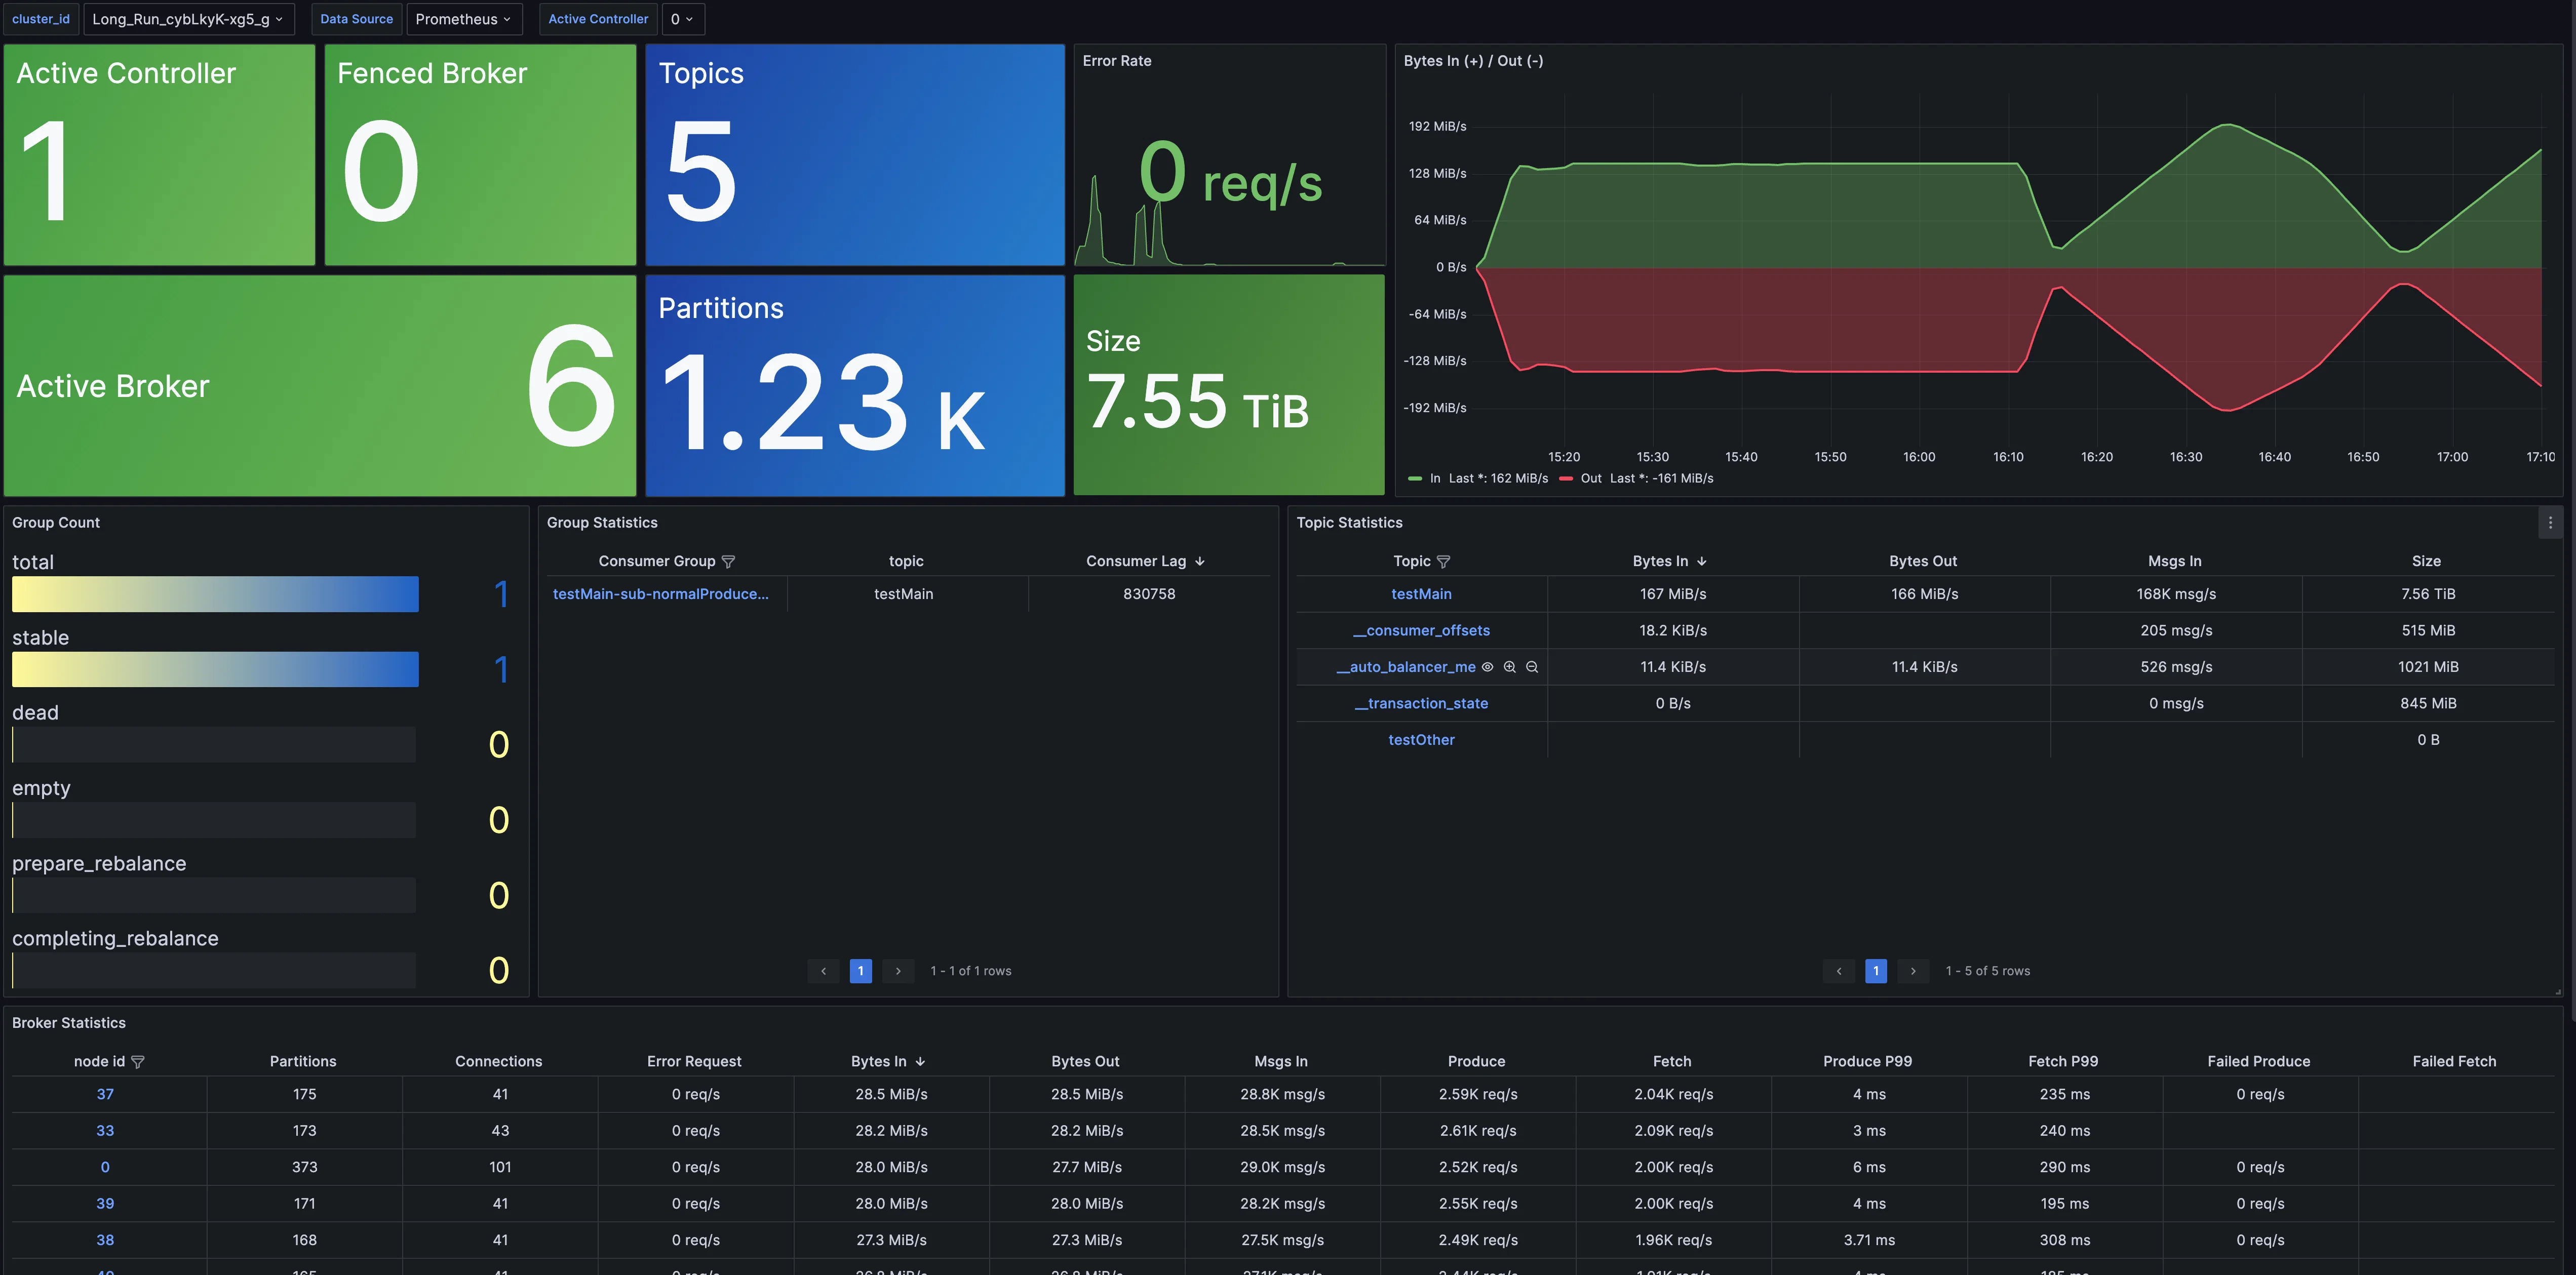
**Cluster Overview** 提供了集群级别的监控信息,包括节点数量、数据大小、集群流量等指标。此外,还提供了 Topic、Group、Broker 等维度的概览指标,并支持进一步查看详细监控信息的下钻功能。
 ### Broker 仪表盘
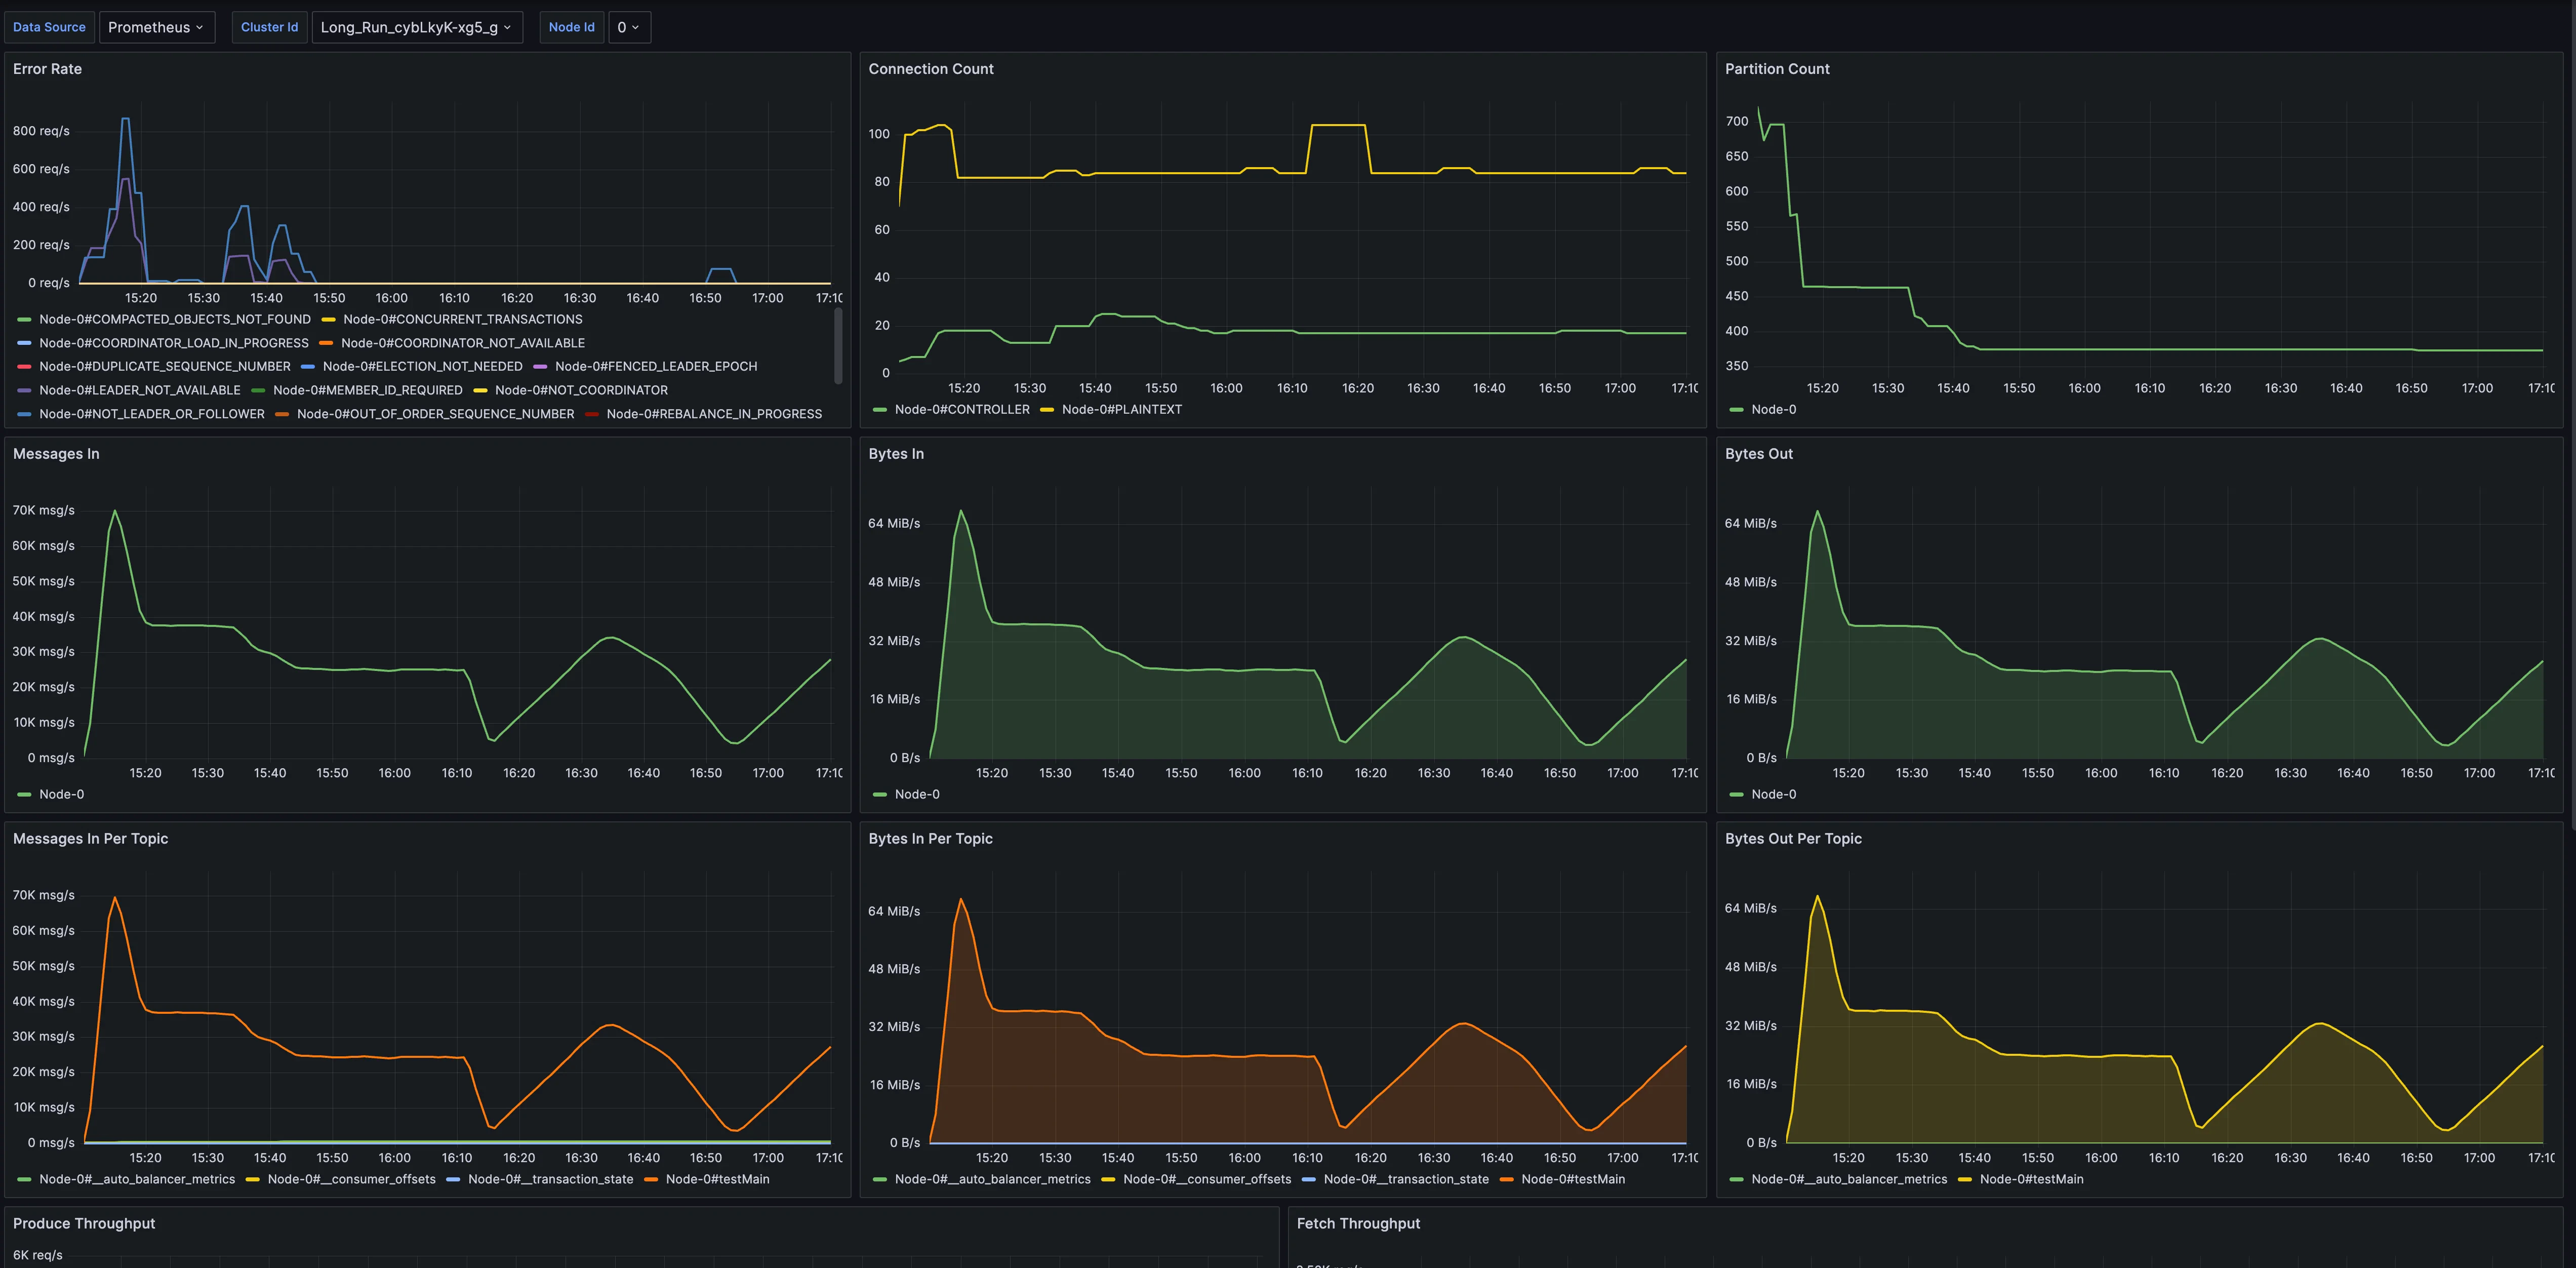
**Broker Metrics** 提供了针对 Broker 的监控数据,涵盖连接数、分区数、节点流量以及节点请求等指标。
### Broker 仪表盘
**Broker Metrics** 提供了针对 Broker 的监控数据,涵盖连接数、分区数、节点流量以及节点请求等指标。
 ### Topic 仪表盘
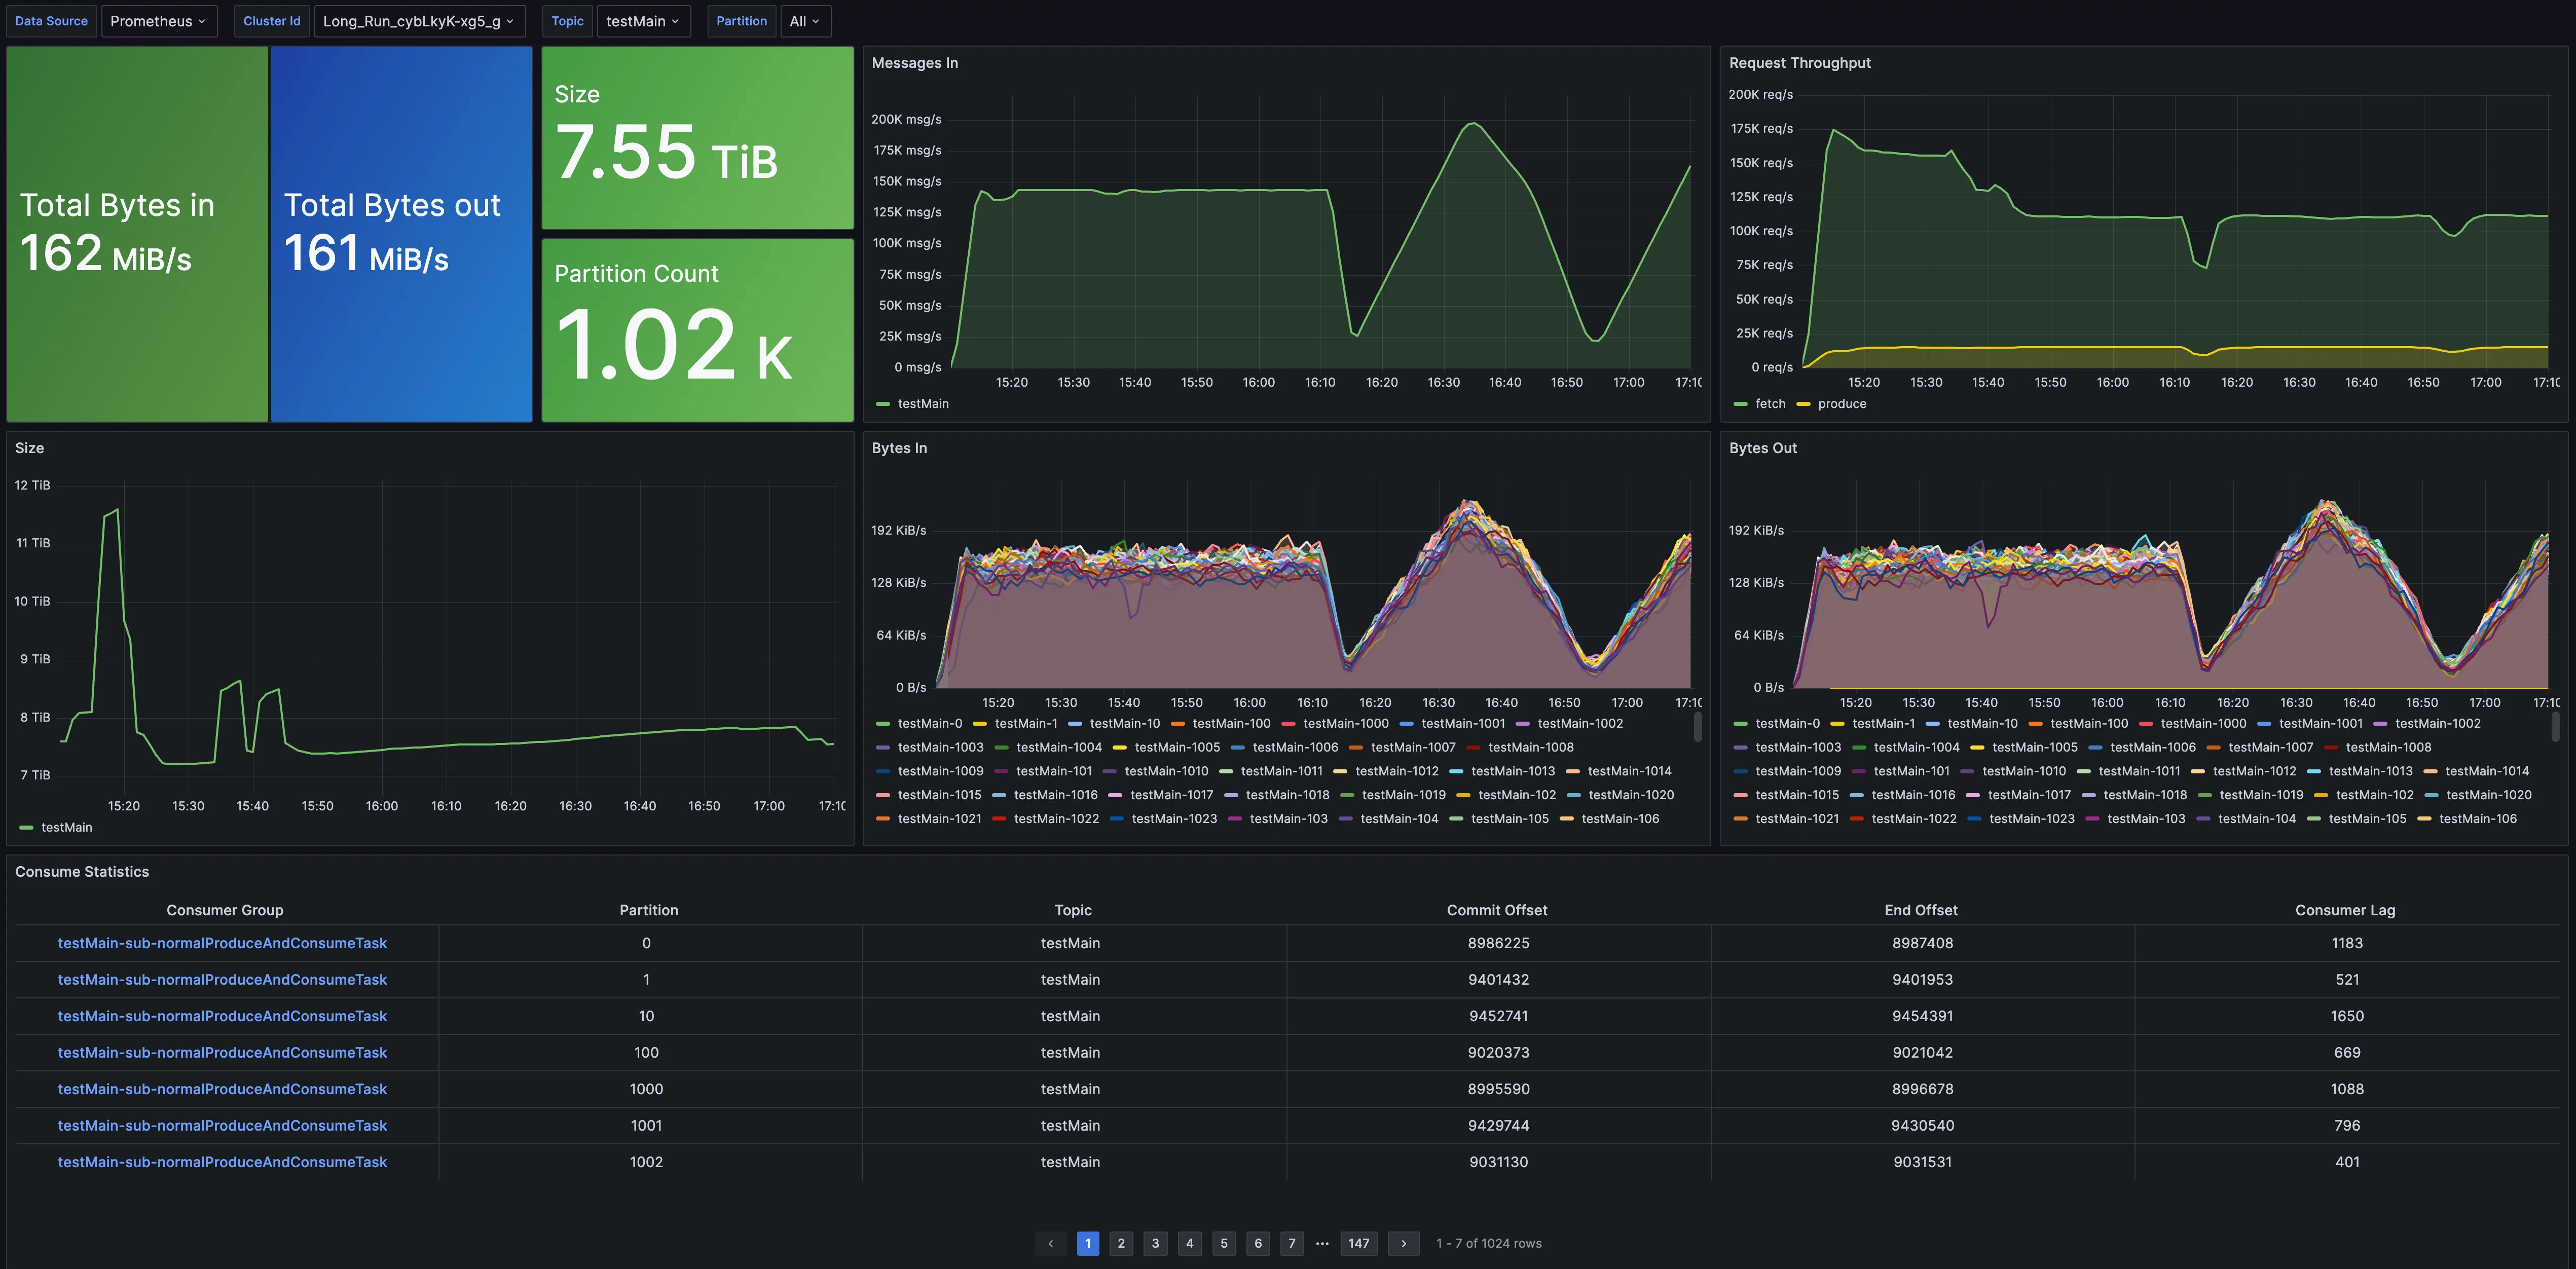
**Topic Metrics** 提供了针对 Topic 的指标监控,包括消息吞吐、数据总量、分区数量、消费延迟等。
### Topic 仪表盘
**Topic Metrics** 提供了针对 Topic 的指标监控,包括消息吞吐、数据总量、分区数量、消费延迟等。
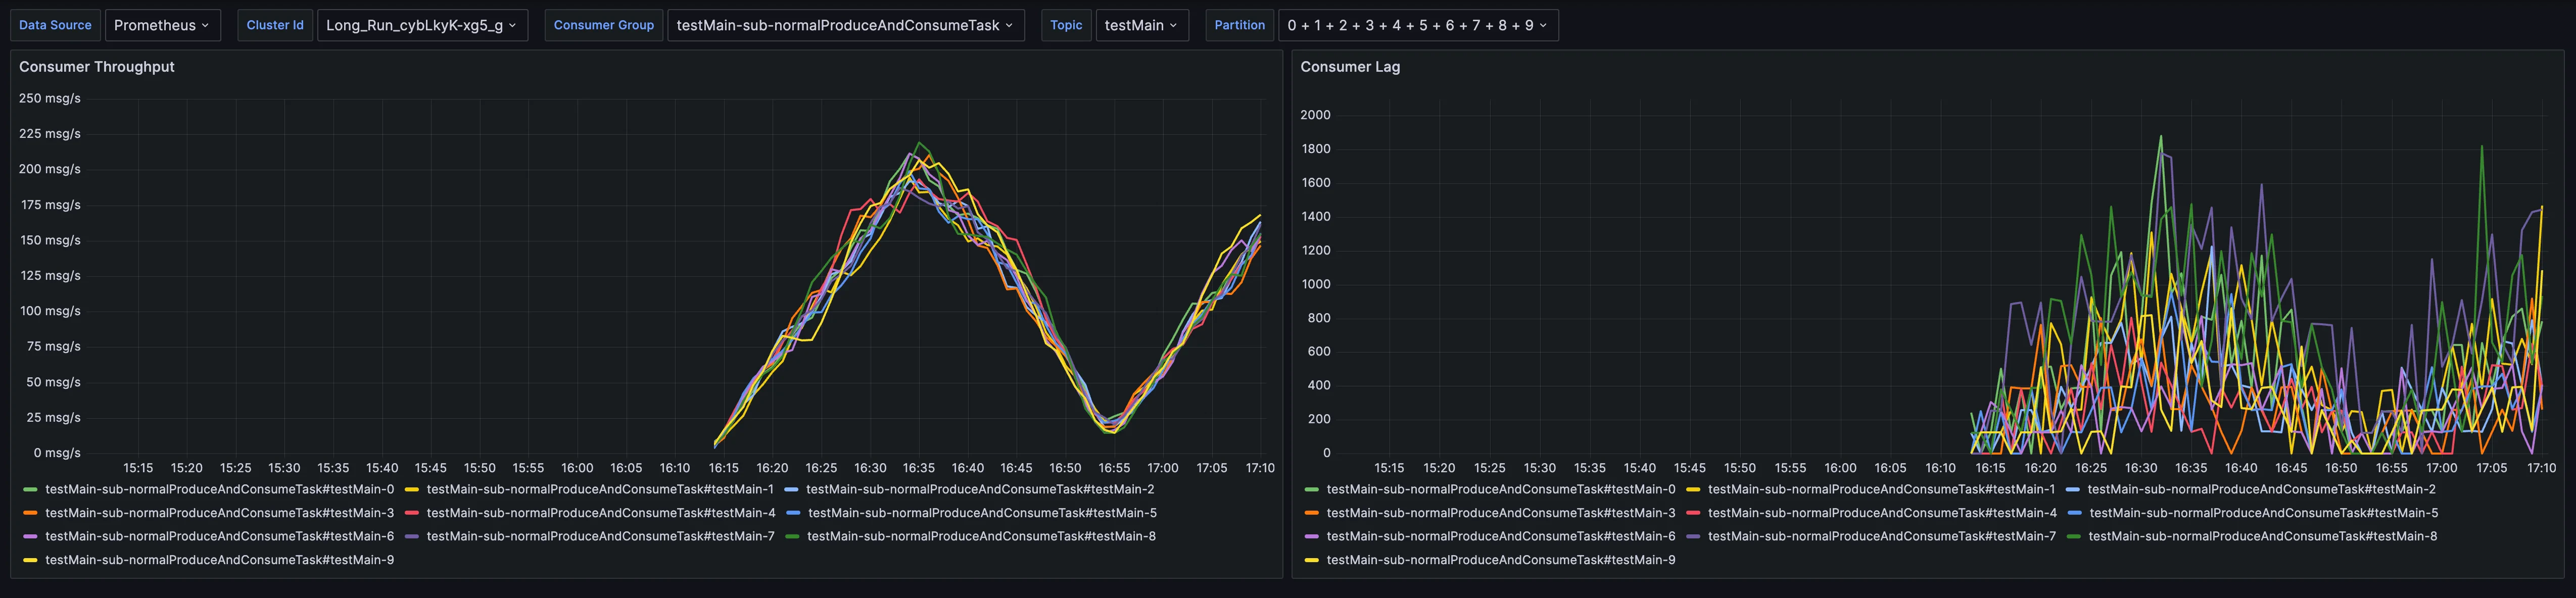
 ### Group 仪表盘
**Group Metrics** 提供了针对 Group 的指标监控,包括消费速率和消费延迟。
### Group 仪表盘
**Group Metrics** 提供了针对 Group 的指标监控,包括消费速率和消费延迟。
 ### Detail 仪表盘
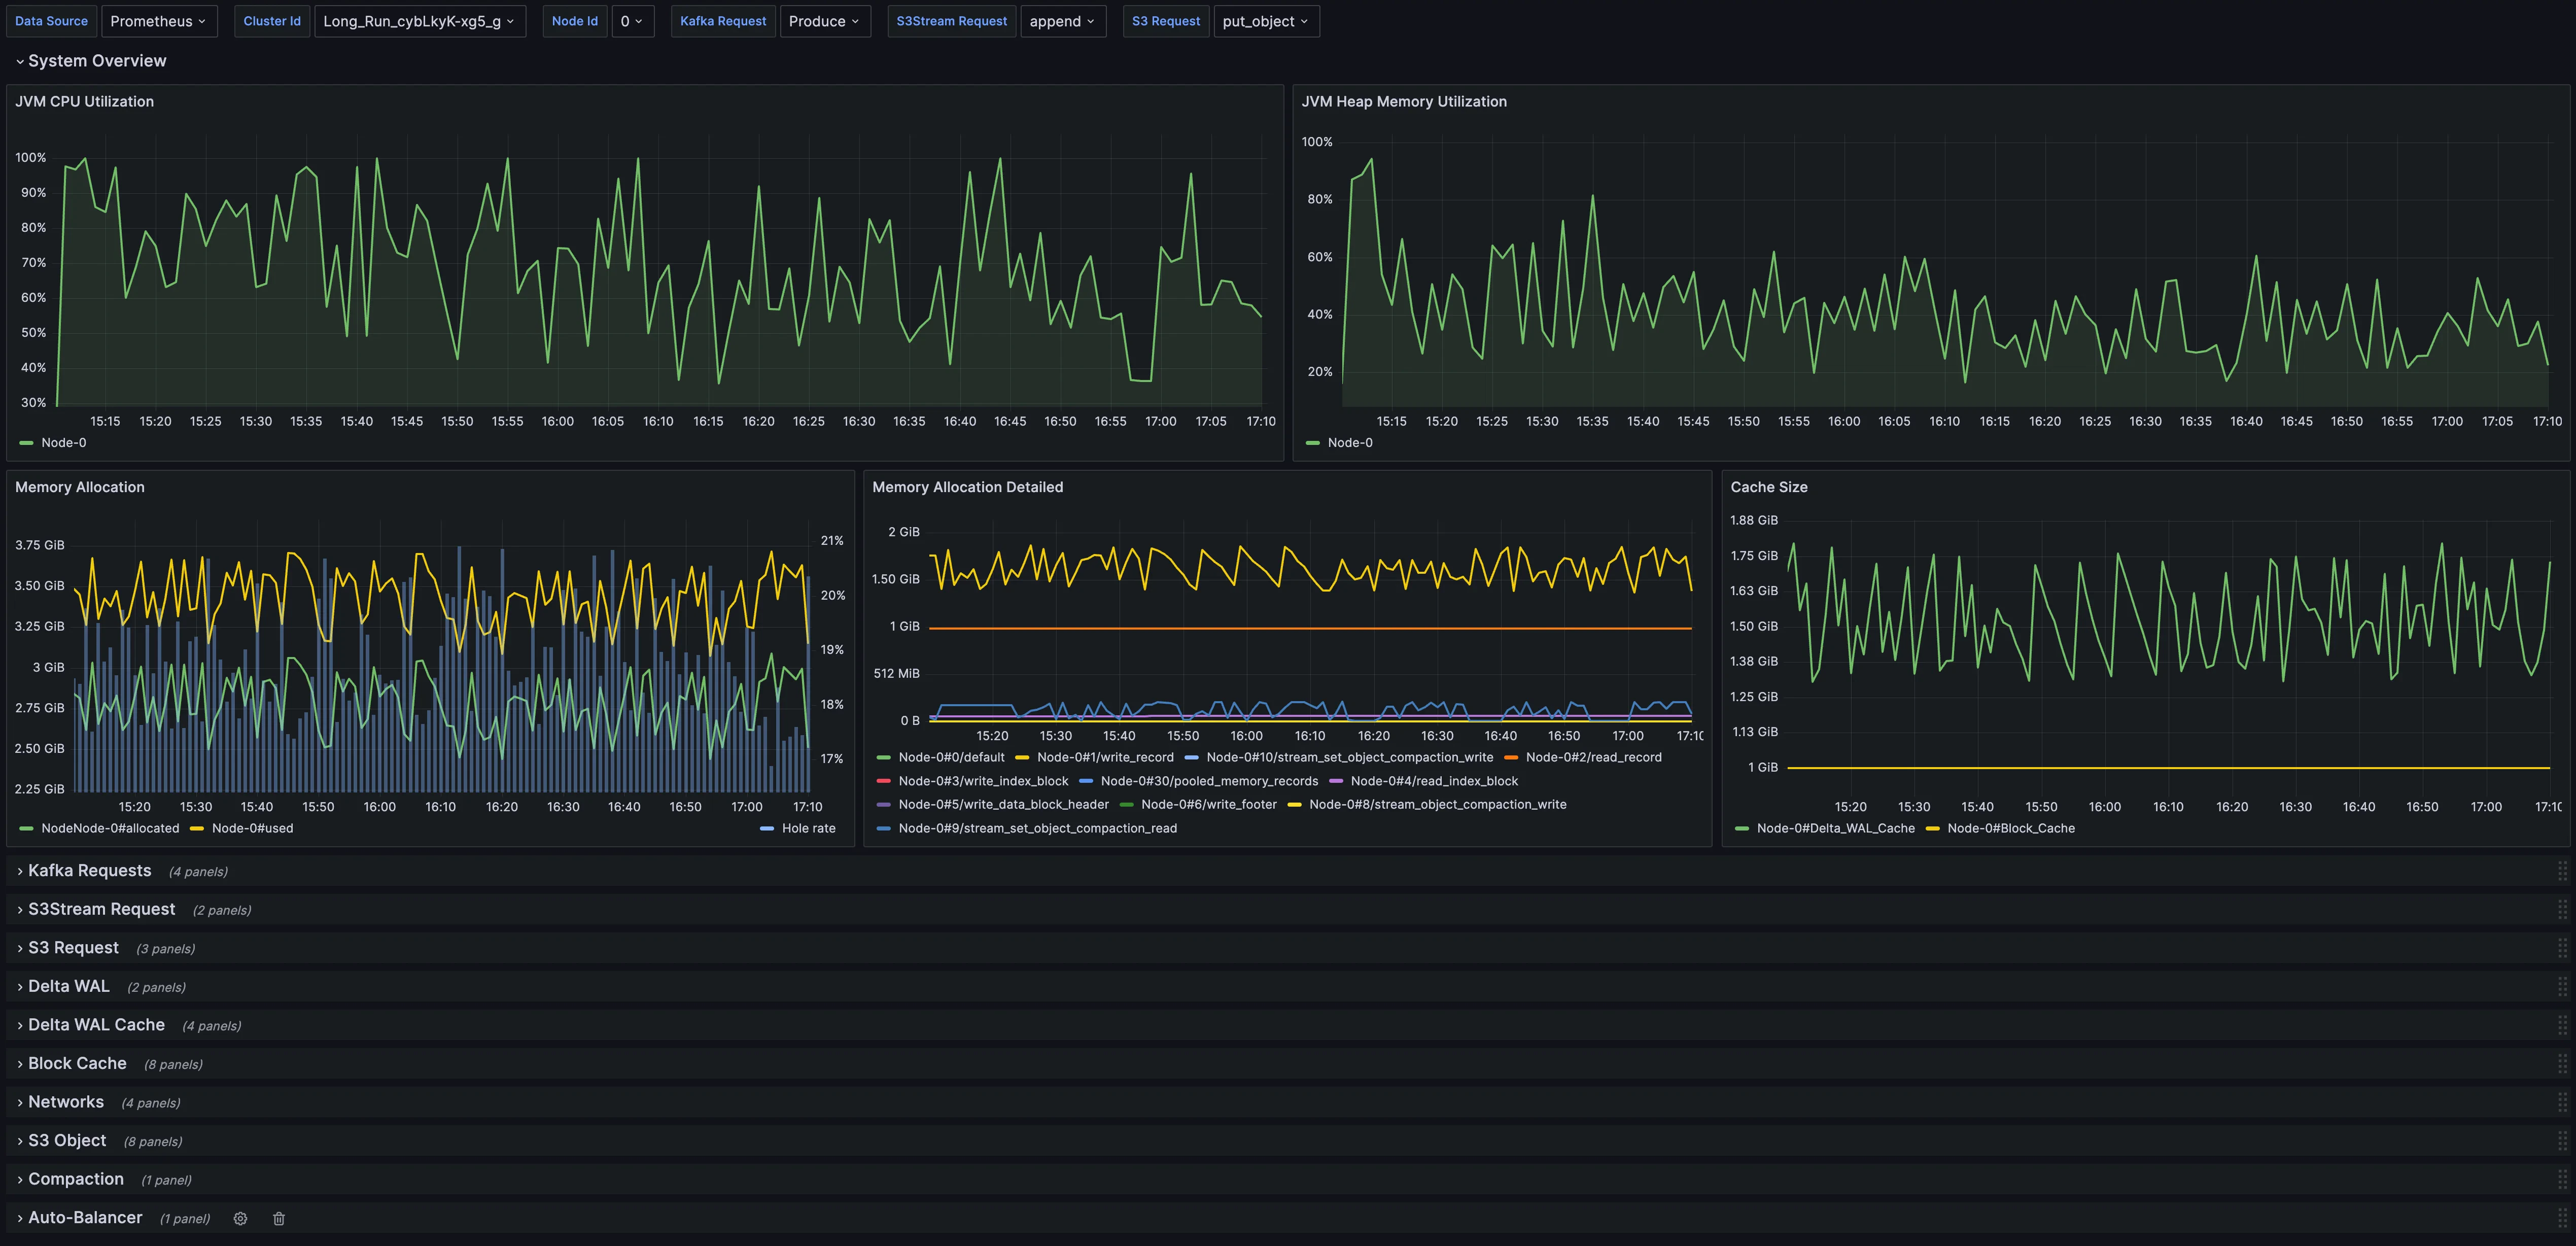
**Detailed Metrics** 提供详细的实现层指标监控,帮助开发者进行故障排查或深入了解 AutoMQ 的运行机制。
### Detail 仪表盘
**Detailed Metrics** 提供详细的实现层指标监控,帮助开发者进行故障排查或深入了解 AutoMQ 的运行机制。