> ## Documentation Index
> Fetch the complete documentation index at: https://docs.automq.com/llms.txt
> Use this file to discover all available pages before exploring further.
# 将 Metrics 集成到 Prometheus
> 将 AutoMQ 与 Prometheus 集成,实现 Metrics 数据的一站式采集查询。AutoMQ 提供 Kafka 兼容性,云原生可扩展性和成本效益。
Prometheus 是一款广受欢迎的监控、报警和时序数据存储服务,能够方便地实现 Metrics 的采集、存储和监控查询。本文介绍如何将 AutoMQ 与 Prometheus 集成,以实现 Metrics 数据的一站式采集查询。
## Metrics 集成
AutoMQ 开源版使用 OpenTelemetry SDK 实现 Metrics 采集和导出,支持透出 Apache Kafka 业务指标和底层存储实现相关指标,这两类指标统一使用 OTLP 格式进行转换和透出。
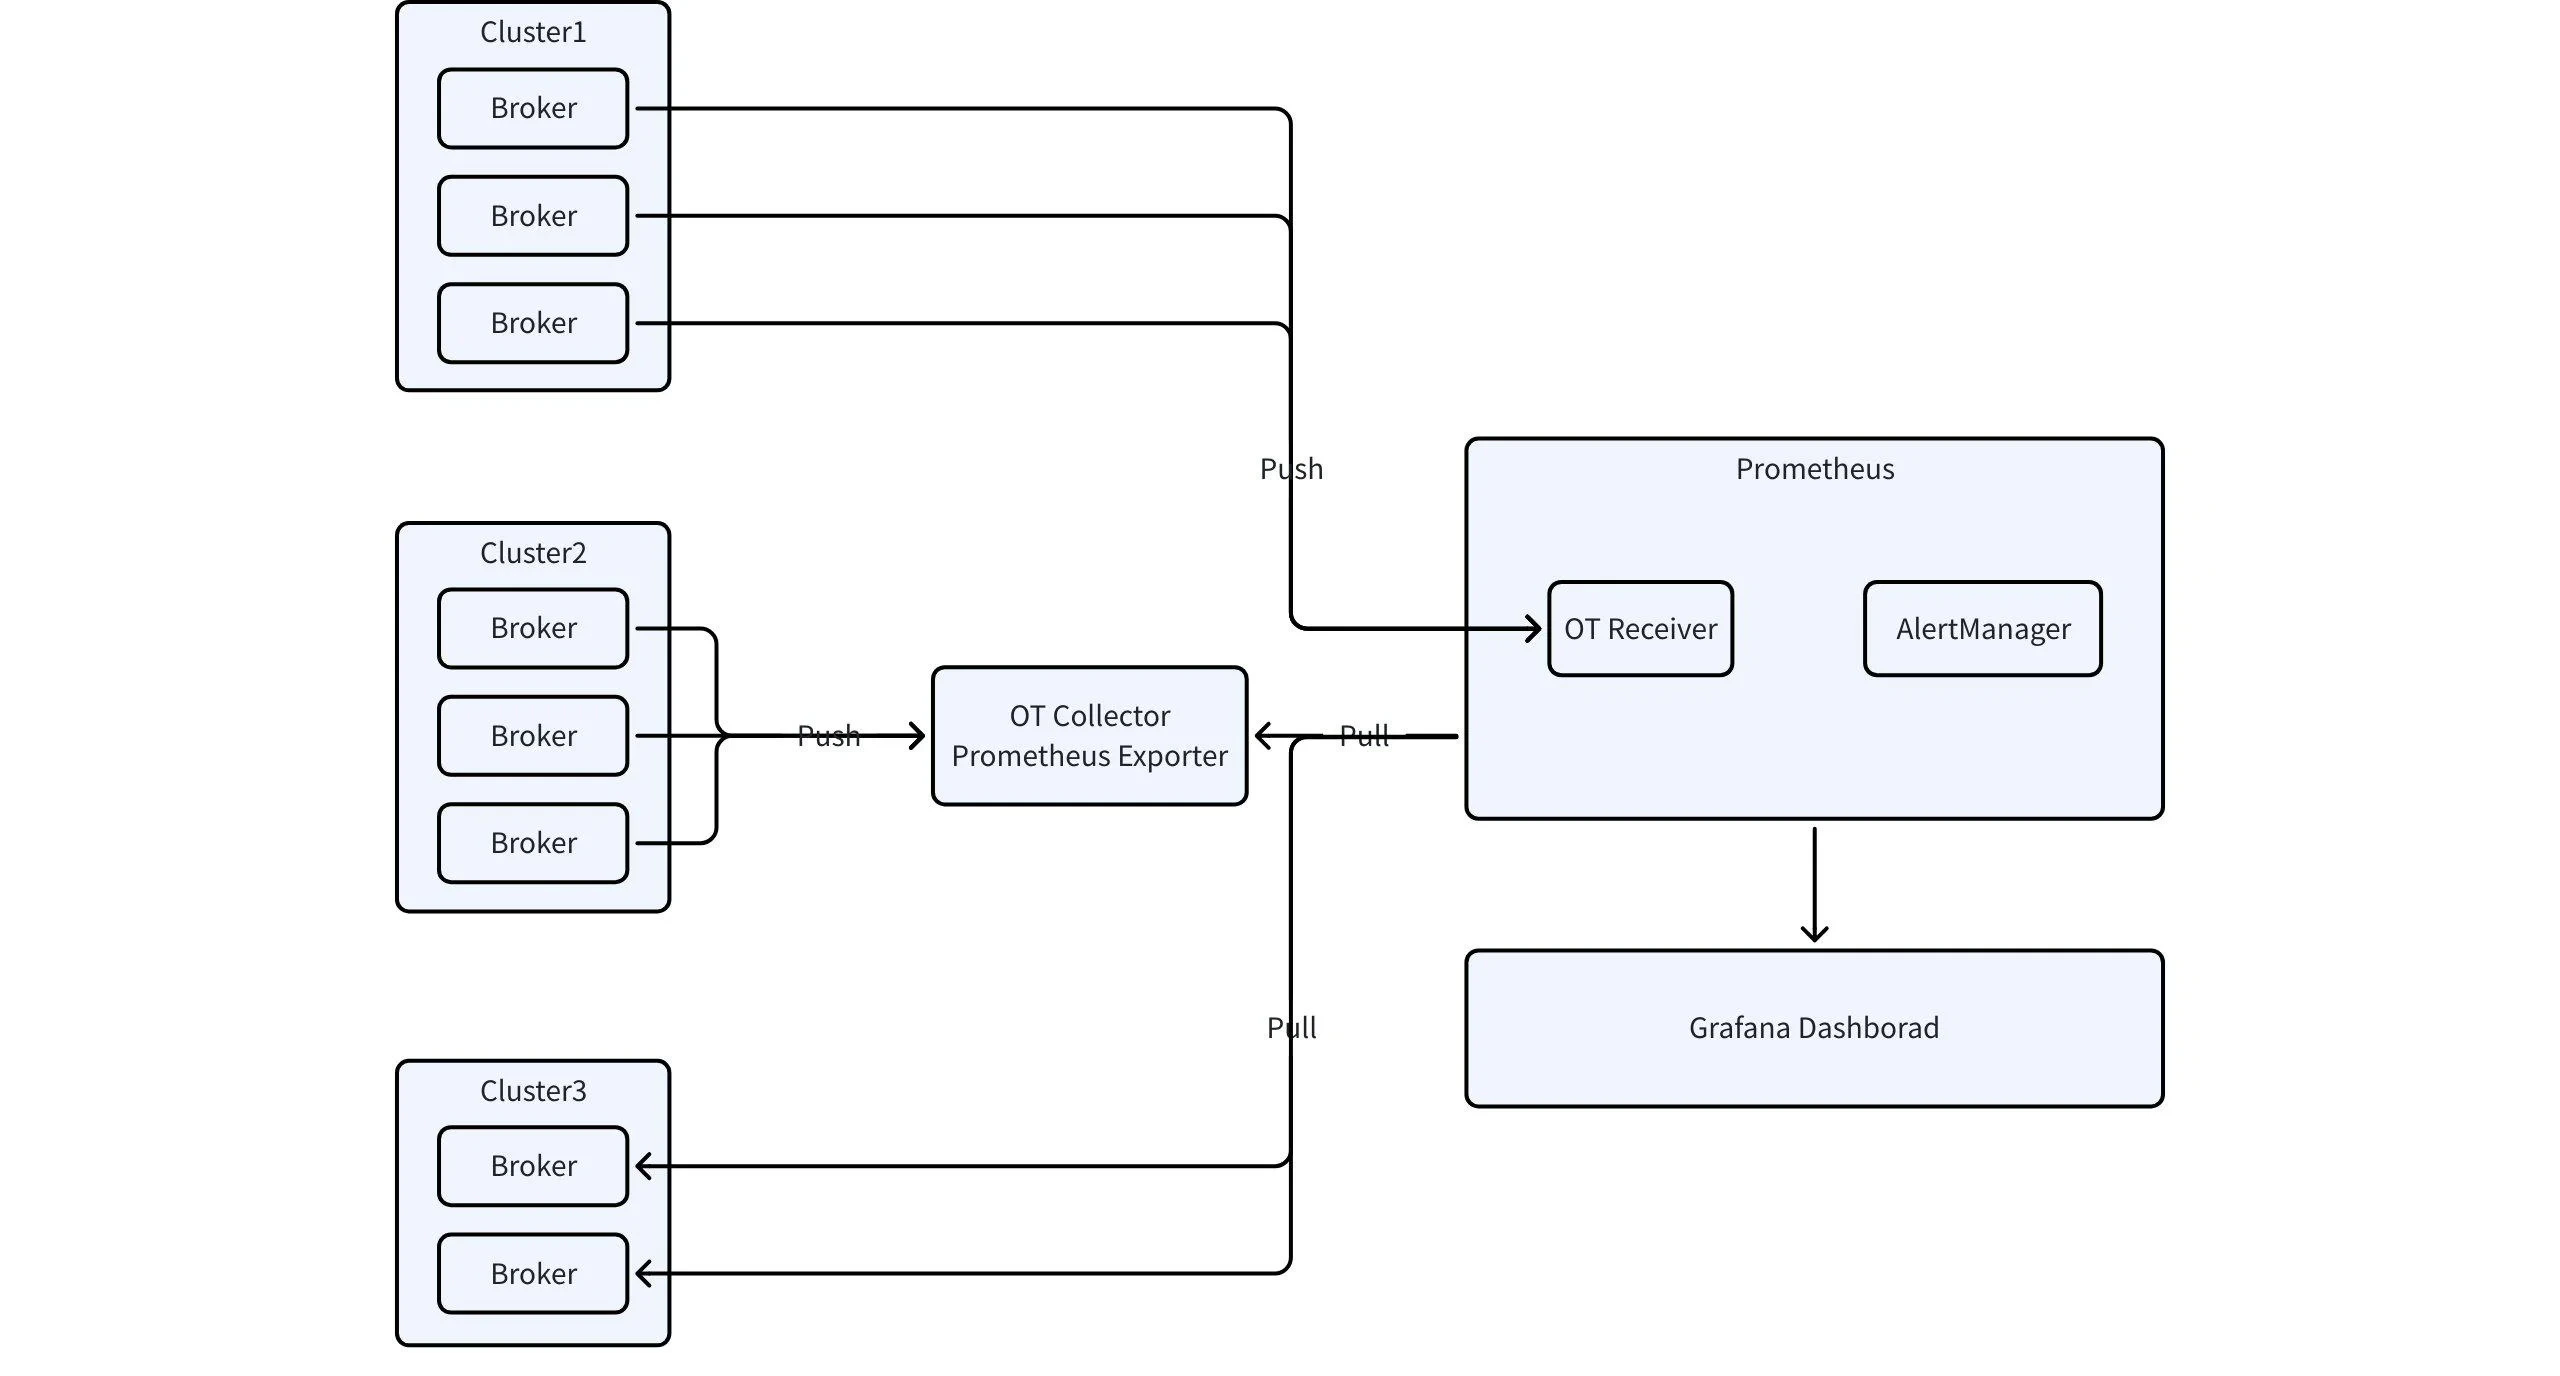 针对上图,首先选择合适的 Metrics 导出方案,将 Metrics 数据导出到 Prometheus 中。导出 Metrics 数据有如下三种方式:
* 使用 OpenTelemetry Collector
* 使用 Prometheus OTLP Receiver
* 直接从服务端拉取 Metrics
## Prometheus Metrics 定义
通过 OT Collector 或者 Prometheus OTLP Receiver 将指标集成到 Prometheus 后,您可以参考[Prometheus Metrics▸](/zh/automq/observability/prometheus-metrics) 查看指标定义。
## 方案一:使用 OpenTelemetry Collector
1. 启动 OpenTelemetry Collector 并配置 Prometheus Exporter 来收集和导出指标数据。
```yaml theme={null}
exporters:
prometheus:
endpoint: $endpoint_for_promehteus
```
2. 启动 Prometheus 服务时,请确保添加以下配置。
```yaml theme={null}
scrape_configs:
- job_name: $job_name
scrape_interval: 5s
honor_labels: true # DO NOT CHANGE THIS
static_configs:
- targets: ["$endpoint_for_prometheus"]
```
3. 配置 AutoMQ 将指标数据推送至 Collector。
```properties theme={null}
s3.telemetry.metrics.exporter.type=otlp
s3.telemetry.exporter.otlp.protocol=grpc
s3.telemetry.exporter.otlp.endpoint=http://${endpoint}:4317
# or with http protocol
# s3.telemetry.exporter.otlp.protocol=http
# s3.telemetry.exporter.otlp.endpoint=http://${endpoint}:4318/v1/metrics
```
## 方案二:使用 Prometheus OTLP Receiver
### **集成到开源自建 Prometheus**
根据 Prometheus 的[版本要求](https://prometheus.io/docs/prometheus/latest/querying/api/#otlp-receiver),用户的 Prometheus 服务需要符合如下条件:
* Prometheus 版本至少为 2.47。
* Prometheus 需开启 featuer flsgs: --enable-feature=otlp-write-receiver。开启方法参考下方命令。
```bash theme={null}
./prometheus --config.file=prometheus.yml --enable-feature=otlp-write-receiver
```
如果当前自建 Prometheus 服务是基于 [VictoriaMetrics](https://github.com/VictoriaMetrics/VictoriaMetrics) 企业版服务,需要确保 [VictoriaMetrics](https://github.com/VictoriaMetrics/VictoriaMetrics) 的版本至少为 1.92.0,并按照相关文档[配置接入点](https://docs.victoriametrics.com/single-server-victoriametrics/#sending-data-via-opentelemetry)。
### **集成到云厂商 Prometheus 服务**
如果用户使用公共云厂商提供的托管服务,建议咨询云厂商技术人员。以阿里云为例,阿里云 Prometheus 服务提供开箱即用的 OT 协议支持,参考[ OT 协议上报数据文档](https://help.aliyun.com/zh/arms/prometheus-monitoring/instructions-for-using-the-reporting-address-of-opentelemetry-indicator?spm=a2c4g.11186623.0.i1)。
启动 Prometheus 服务后,配置 AutoMQ 将 metrics 推送至 Prometheus:
```properties theme={null}
s3.telemetry.metrics.exporter.type=otlp
s3.telemetry.exporter.otlp.protocol=http
s3.telemetry.exporter.otlp.endpoint=http://${endpoint}:9090/api/v1/otlp/v1/metrics
# or use with Aliyun Prometheus OpenTelemetry Endpoint
# s3.telemetry.exporter.otlp.endpoint=https://${endpoint}/api/v1/metrics
```
## 方案三:直接从服务端拉取 Metrics
在此模式下,AutoMQ 充当 Prometheus HTTP Server,用户可以在 Prometheus 后端服务上配置 scrape 任务,从特定的端点获取 Prometheus Metrics。配置方法如下:
```properties theme={null}
s3.telemetry.metrics.exporter.type=prometheus
s3.metrics.exporter.prom.host=127.0.0.1
s3.metrics.exporter.prom.port=9090
```
针对上图,首先选择合适的 Metrics 导出方案,将 Metrics 数据导出到 Prometheus 中。导出 Metrics 数据有如下三种方式:
* 使用 OpenTelemetry Collector
* 使用 Prometheus OTLP Receiver
* 直接从服务端拉取 Metrics
## Prometheus Metrics 定义
通过 OT Collector 或者 Prometheus OTLP Receiver 将指标集成到 Prometheus 后,您可以参考[Prometheus Metrics▸](/zh/automq/observability/prometheus-metrics) 查看指标定义。
## 方案一:使用 OpenTelemetry Collector
1. 启动 OpenTelemetry Collector 并配置 Prometheus Exporter 来收集和导出指标数据。
```yaml theme={null}
exporters:
prometheus:
endpoint: $endpoint_for_promehteus
```
2. 启动 Prometheus 服务时,请确保添加以下配置。
```yaml theme={null}
scrape_configs:
- job_name: $job_name
scrape_interval: 5s
honor_labels: true # DO NOT CHANGE THIS
static_configs:
- targets: ["$endpoint_for_prometheus"]
```
3. 配置 AutoMQ 将指标数据推送至 Collector。
```properties theme={null}
s3.telemetry.metrics.exporter.type=otlp
s3.telemetry.exporter.otlp.protocol=grpc
s3.telemetry.exporter.otlp.endpoint=http://${endpoint}:4317
# or with http protocol
# s3.telemetry.exporter.otlp.protocol=http
# s3.telemetry.exporter.otlp.endpoint=http://${endpoint}:4318/v1/metrics
```
## 方案二:使用 Prometheus OTLP Receiver
### **集成到开源自建 Prometheus**
根据 Prometheus 的[版本要求](https://prometheus.io/docs/prometheus/latest/querying/api/#otlp-receiver),用户的 Prometheus 服务需要符合如下条件:
* Prometheus 版本至少为 2.47。
* Prometheus 需开启 featuer flsgs: --enable-feature=otlp-write-receiver。开启方法参考下方命令。
```bash theme={null}
./prometheus --config.file=prometheus.yml --enable-feature=otlp-write-receiver
```
如果当前自建 Prometheus 服务是基于 [VictoriaMetrics](https://github.com/VictoriaMetrics/VictoriaMetrics) 企业版服务,需要确保 [VictoriaMetrics](https://github.com/VictoriaMetrics/VictoriaMetrics) 的版本至少为 1.92.0,并按照相关文档[配置接入点](https://docs.victoriametrics.com/single-server-victoriametrics/#sending-data-via-opentelemetry)。
### **集成到云厂商 Prometheus 服务**
如果用户使用公共云厂商提供的托管服务,建议咨询云厂商技术人员。以阿里云为例,阿里云 Prometheus 服务提供开箱即用的 OT 协议支持,参考[ OT 协议上报数据文档](https://help.aliyun.com/zh/arms/prometheus-monitoring/instructions-for-using-the-reporting-address-of-opentelemetry-indicator?spm=a2c4g.11186623.0.i1)。
启动 Prometheus 服务后,配置 AutoMQ 将 metrics 推送至 Prometheus:
```properties theme={null}
s3.telemetry.metrics.exporter.type=otlp
s3.telemetry.exporter.otlp.protocol=http
s3.telemetry.exporter.otlp.endpoint=http://${endpoint}:9090/api/v1/otlp/v1/metrics
# or use with Aliyun Prometheus OpenTelemetry Endpoint
# s3.telemetry.exporter.otlp.endpoint=https://${endpoint}/api/v1/metrics
```
## 方案三:直接从服务端拉取 Metrics
在此模式下,AutoMQ 充当 Prometheus HTTP Server,用户可以在 Prometheus 后端服务上配置 scrape 任务,从特定的端点获取 Prometheus Metrics。配置方法如下:
```properties theme={null}
s3.telemetry.metrics.exporter.type=prometheus
s3.metrics.exporter.prom.host=127.0.0.1
s3.metrics.exporter.prom.port=9090
```