Integrating Metrics with Prometheus
Prometheus is a highly regarded service for monitoring, alerting, and storing time-series data, enabling efficient collection, storage, and query handling of Metrics. This article discusses how to seamlessly integrate AutoMQ with Prometheus to streamline Metrics data collection and querying.
The capability to integrate Metrics into Prometheus is exclusively available in the Business Edition of AutoMQ. If you're interested in evaluating or learning more about the Business Essential, please fill out this form, and our product experts will reach out to you soon.
For further details on the differences between the Community Edition and the Business Edition, please refer to Licensing▸.
Metrics Integration
AutoMQ employs the OpenTelemetry SDK for collecting and exporting Metrics, which facilitates the exposure of Apache Kafka® operational metrics and metrics related to the underlying storage implementation. Both types of metrics are consistently converted and exposed in the OTLP format.
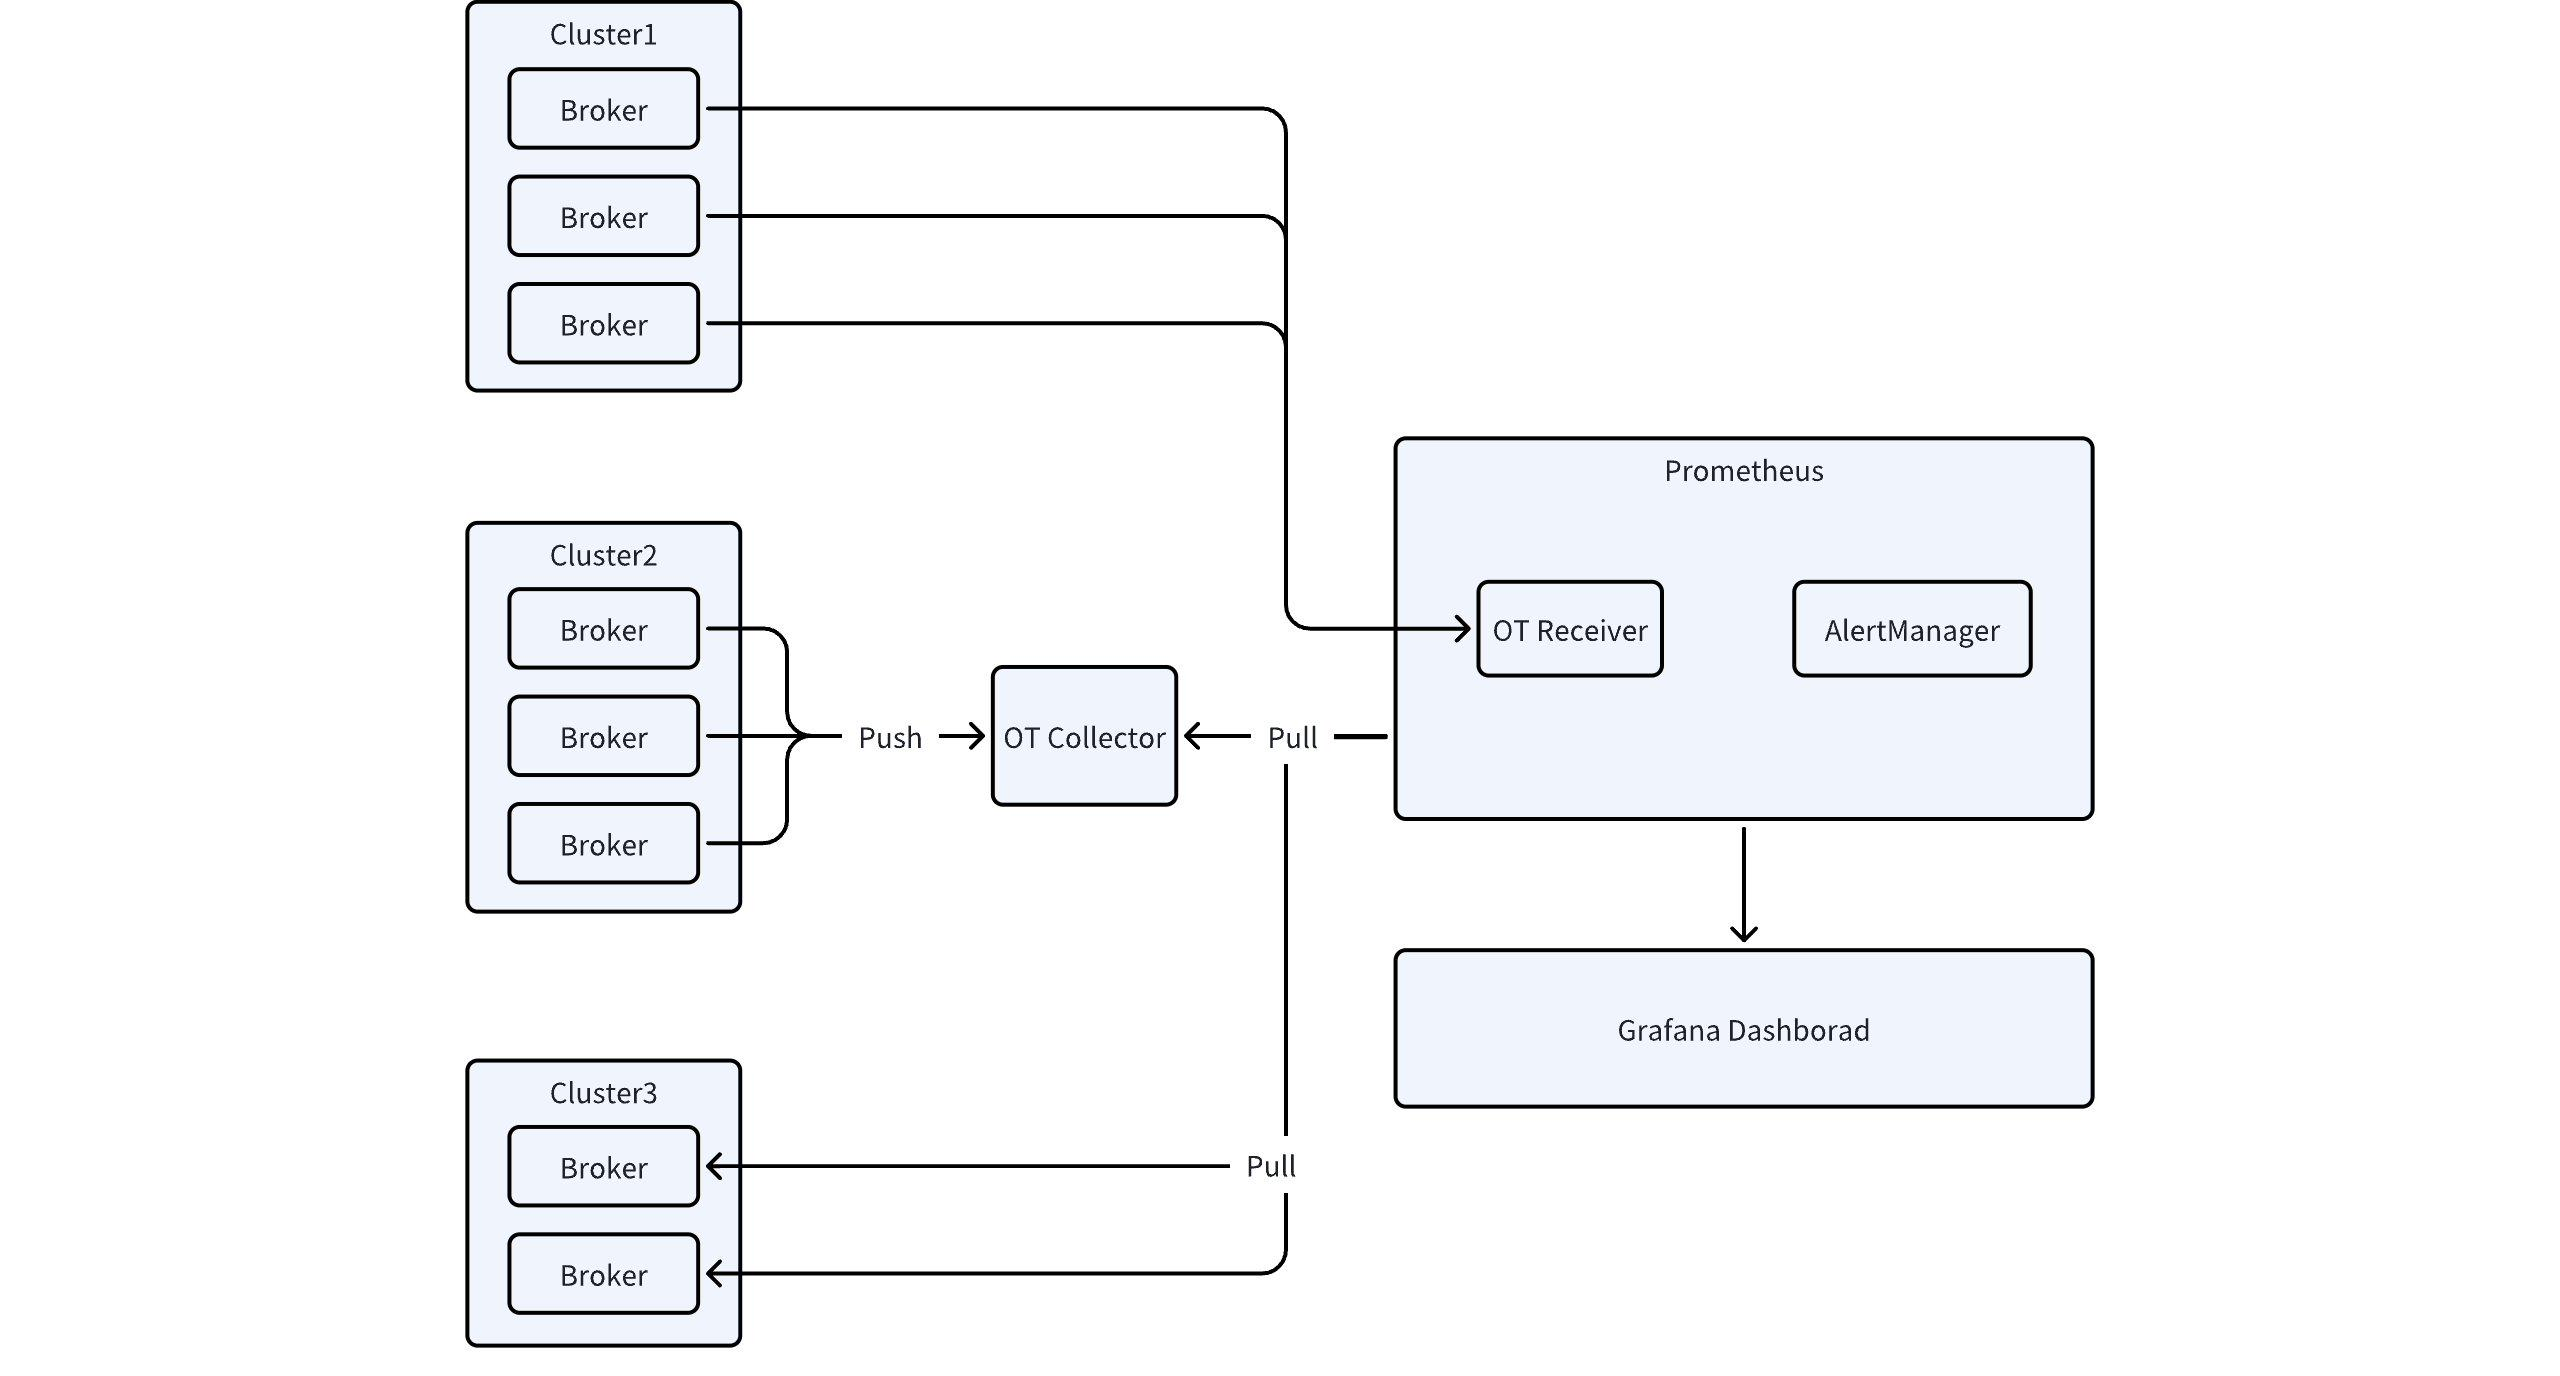
Regarding the figure mentioned earlier, begin by selecting an appropriate Metrics export strategy to channel Metrics data into Prometheus. There are three methods for exporting Metrics data:
Using OpenTelemetry Collector
Using Prometheus OTLP Receiver
Retrieve metrics directly from the server
Option 1: Utilize the OpenTelemetry Collector
- Launch the OpenTelemetry Collector and set up the Prometheus Exporter to gather and export metrics.
exporters:
  prometheus:
    endpoint: $endpoint_for_promehteus
- When initiating the Prometheus service, be sure to incorporate the following configuration.
scrape_configs:
  - job_name: $job_name
    scrape_interval: 5s
    honor_labels: true # DO NOT CHANGE THIS
    static_configs:
      - targets: ["$endpoint_for_prometheus"]
- Configure AutoMQ to forward metric data to the Collector.
s3.telemetry.metrics.exporter.type=otlp
s3.telemetry.exporter.otlp.protocol=grpc
s3.telemetry.exporter.otlp.endpoint=http://${endpoint}:4317

# Or with Http Protocol
# S3.telemetry.exporter.otlp.protocol=http
# S3.telemetry.exporter.otlp.endpoint=http://${endpoint}:4318/v1/metrics
Option 2: Employ the Prometheus OTLP Receiver
Integrate with Open-Source Self-Hosted Prometheus
Based on the version requirements from Prometheus, your Prometheus service must fulfill the following criteria:
Prometheus version must be at least 2.47.
Prometheus must enable feature flags: --enable-feature=otlp-write-receiver. See the command below for activation.
./prometheus --config.file=prometheus.yml --enable-feature=otlp-write-receiver
If you are using a self-hosted Prometheus service based on the VictoriaMetrics Business Edition, make sure that the VictoriaMetrics version is at least 1.92.0 and set up the endpoint as outlined in the relevant documentation here.
Integration with Cloud Providers' Prometheus Services
For users of the commercial versions from public cloud providers, consulting with the provider's technical staff is advisable. For instance, Alibaba Cloud's Prometheus service offers ready-to-use support for the OT protocol; see the OT protocol data reporting documentation for details.
After initiating the Prometheus service, set up AutoMQ to push metrics to Prometheus:
s3.telemetry.metrics.exporter.type=otlp
s3.telemetry.exporter.otlp.protocol=http
s3.telemetry.exporter.otlp.endpoint=http://${endpoint}:9090/api/v1/otlp/v1/metrics

# Or Use with Aliyun Prometheus OpenTelemetry Endpoint
# S3.telemetry.exporter.otlp.endpoint=https://${endpoint}/api/v1/metrics
Option Three: Directly Pull Metrics from the Server
In this mode, AutoMQ functions as a Prometheus HTTP Server, allowing users to set up a scrape job on the Prometheus backend service to collect Prometheus Metrics from a designated endpoint. Follow the configuration steps below:
s3.telemetry.metrics.exporter.type=prometheus
s3.metrics.exporter.prom.host=127.0.0.1
s3.metrics.exporter.prom.port=9090
Metrics Visualization Dashboard
AutoMQ includes a suite of preconfigured Grafana dashboard templates (link). After exporting metrics to Prometheus, you can import these Grafana dashboard templates and set up the Grafana data source to point to the corresponding Prometheus instance, enabling you to commence monitoring AutoMQ.
The preconfigured Grafana dashboard templates facilitate monitoring across several dimensions:
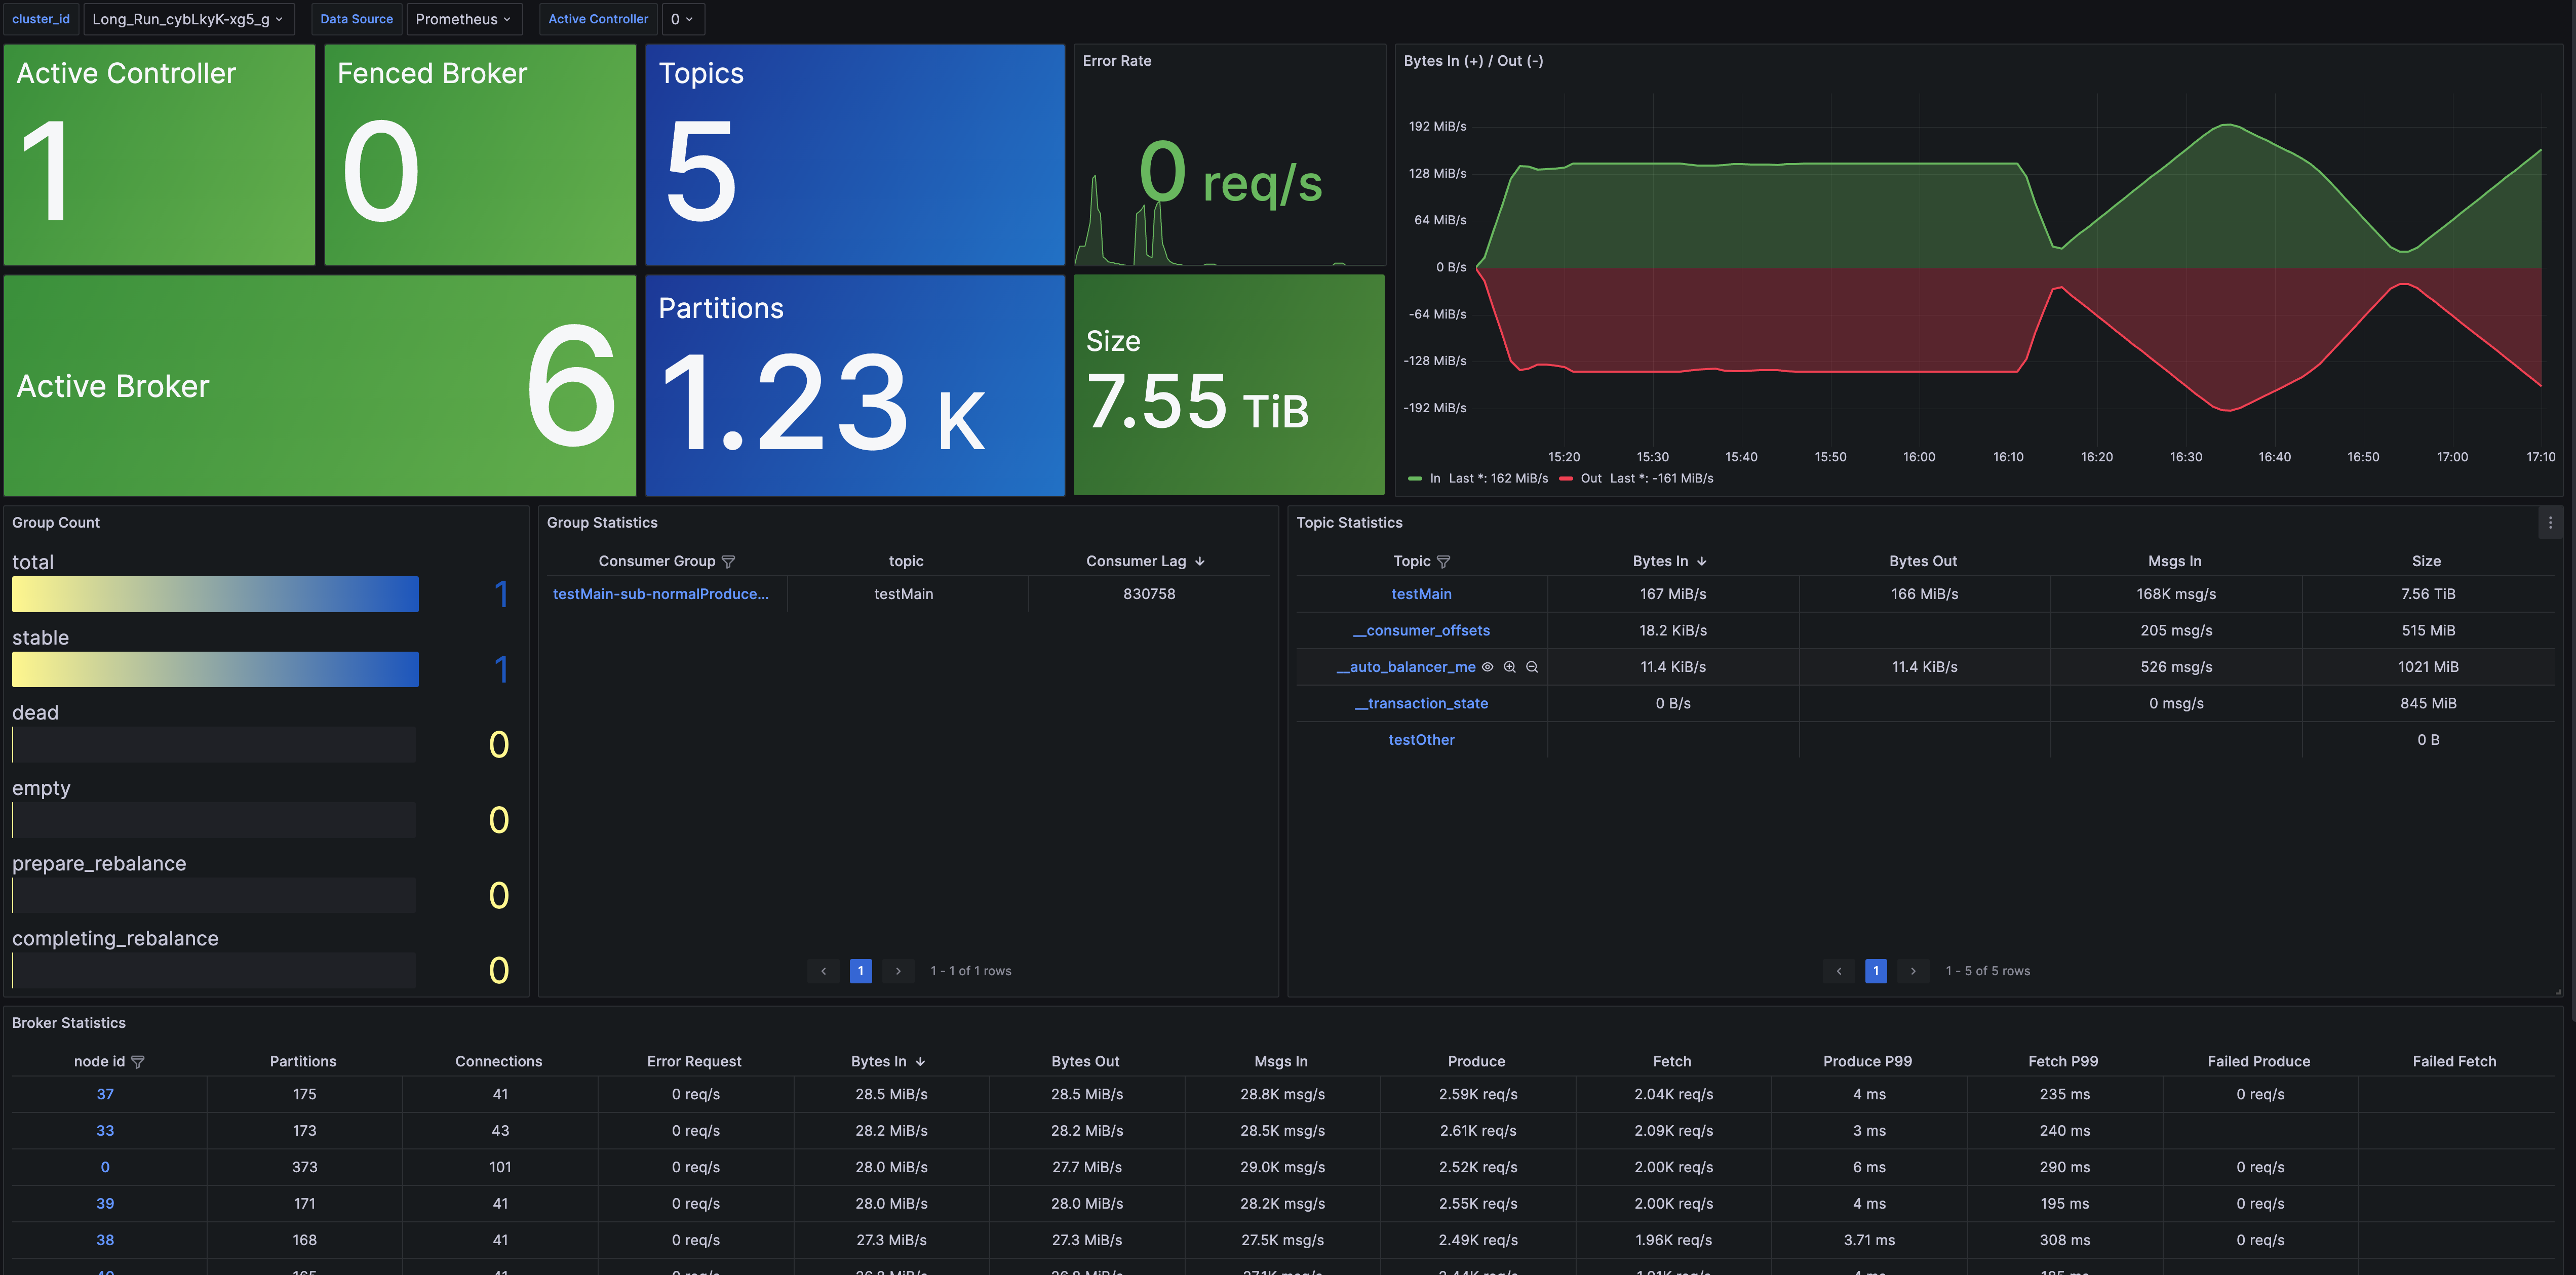
- Cluster Overview: This dashboard provides cluster-level monitoring data, including node count, data size, cluster traffic, and other relevant metrics. It also gives a snapshot of metrics for Topics, Groups, and Brokers, enhancing the scope for detailed monitoring insights.
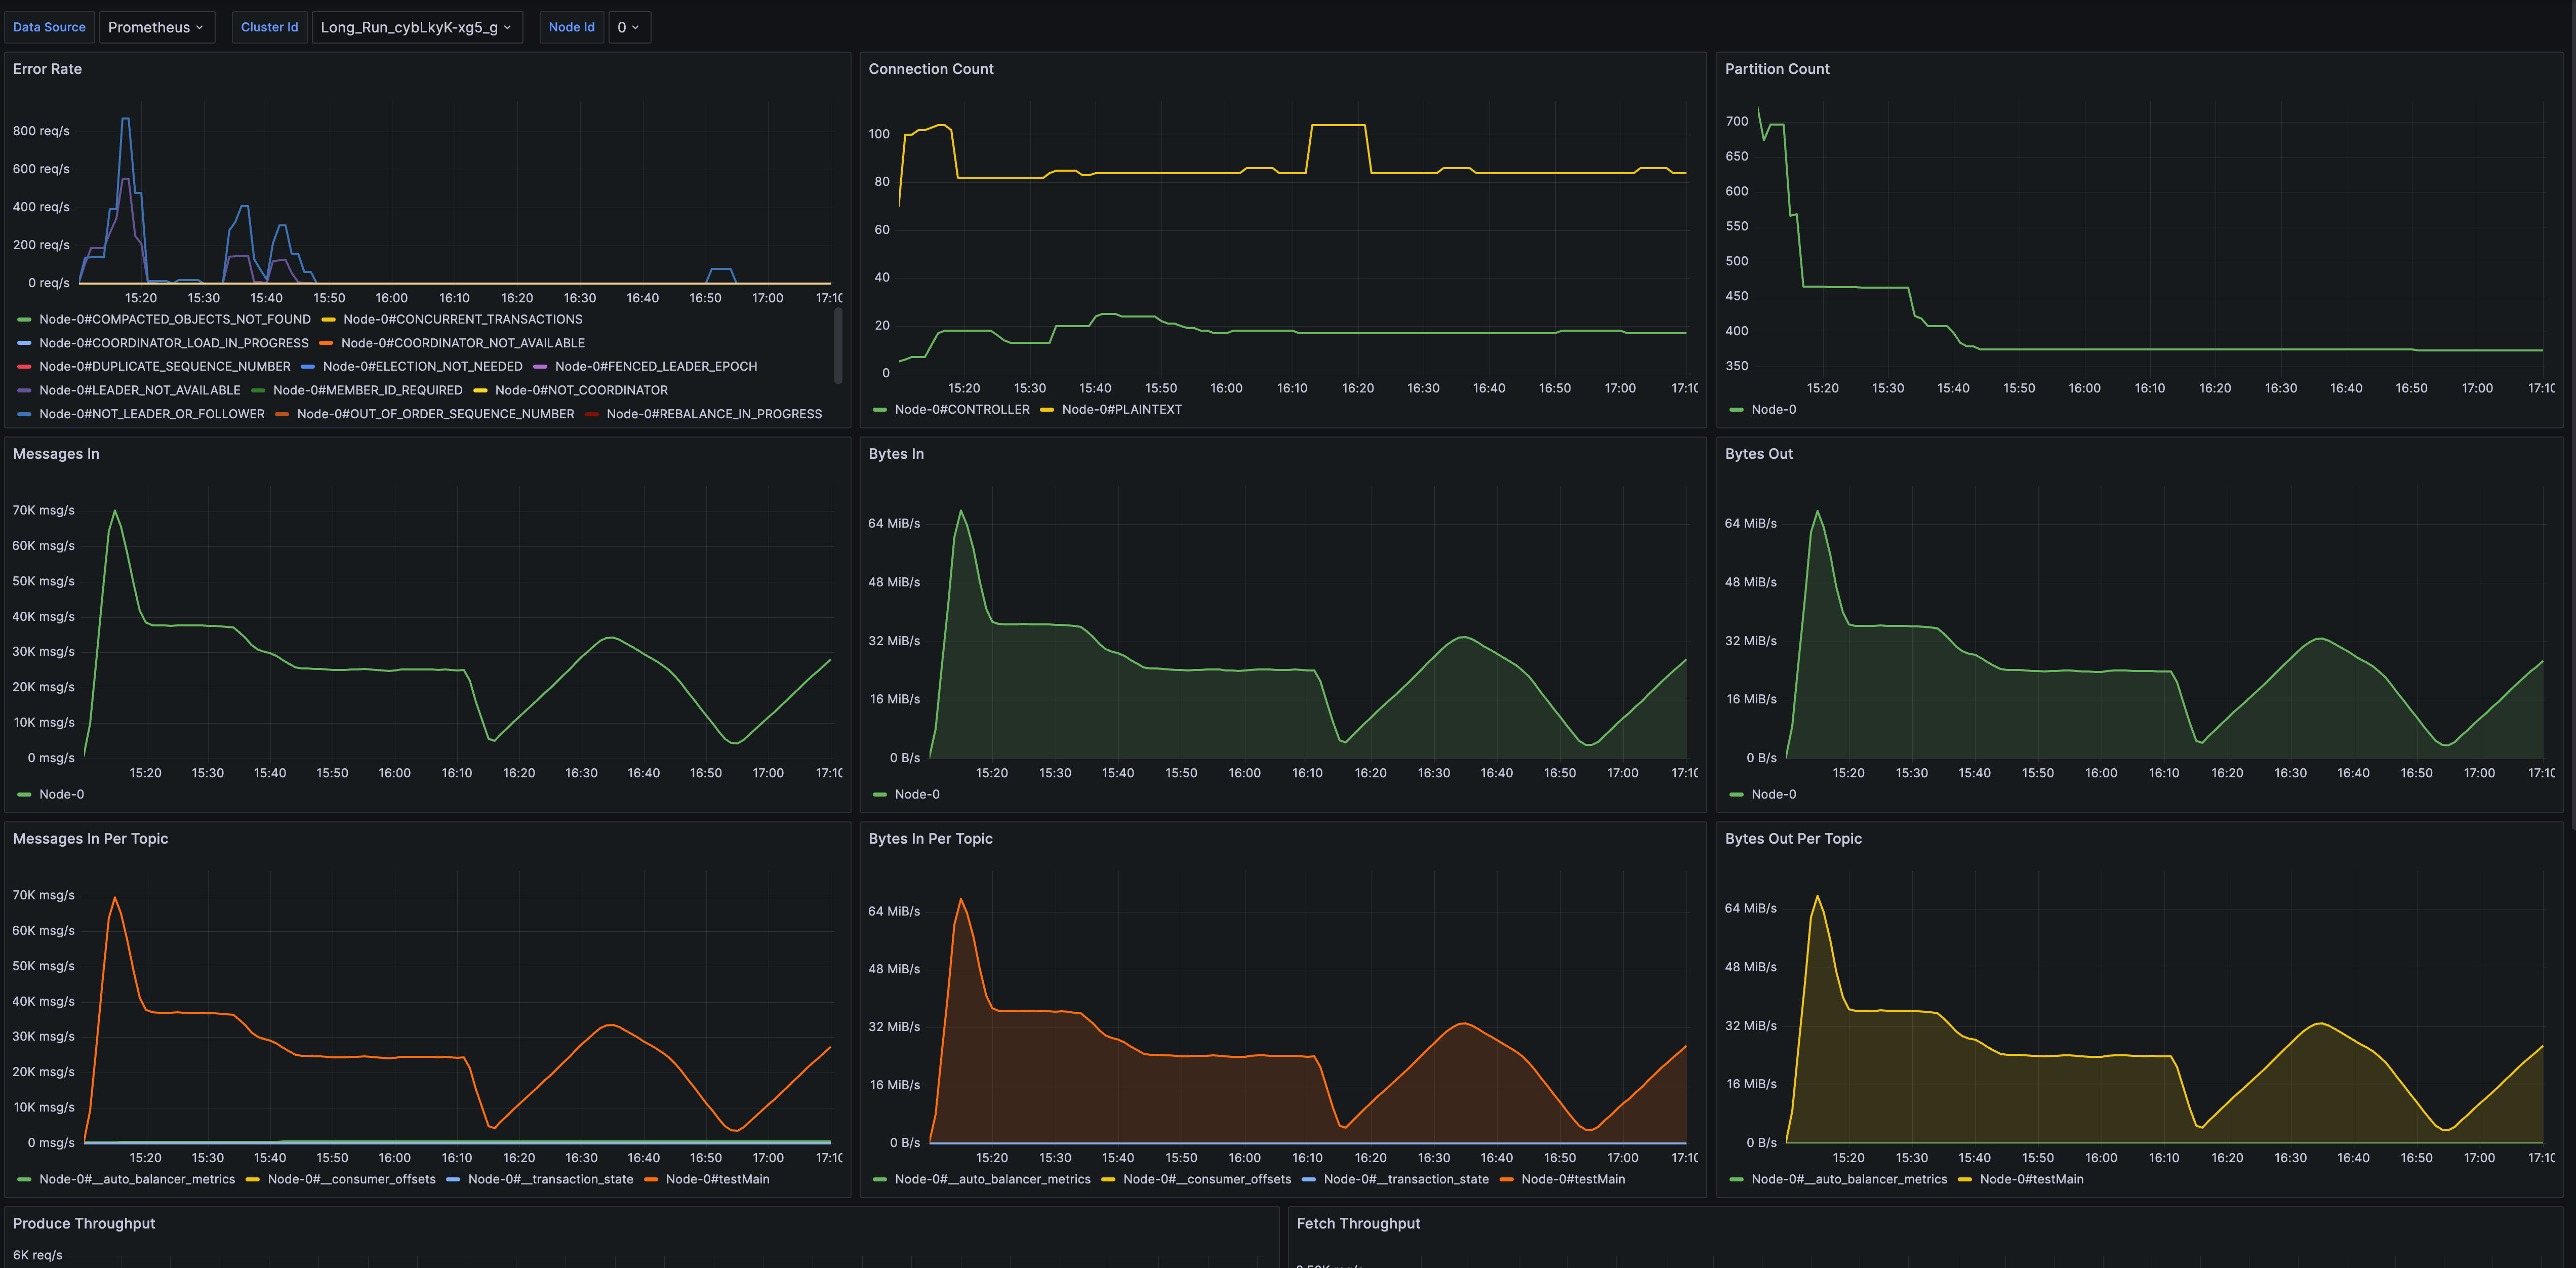
- Broker Metrics: This dashboard delivers monitoring data specifically for Brokers, encompassing connections, number of partitions, node traffic, and node requests.
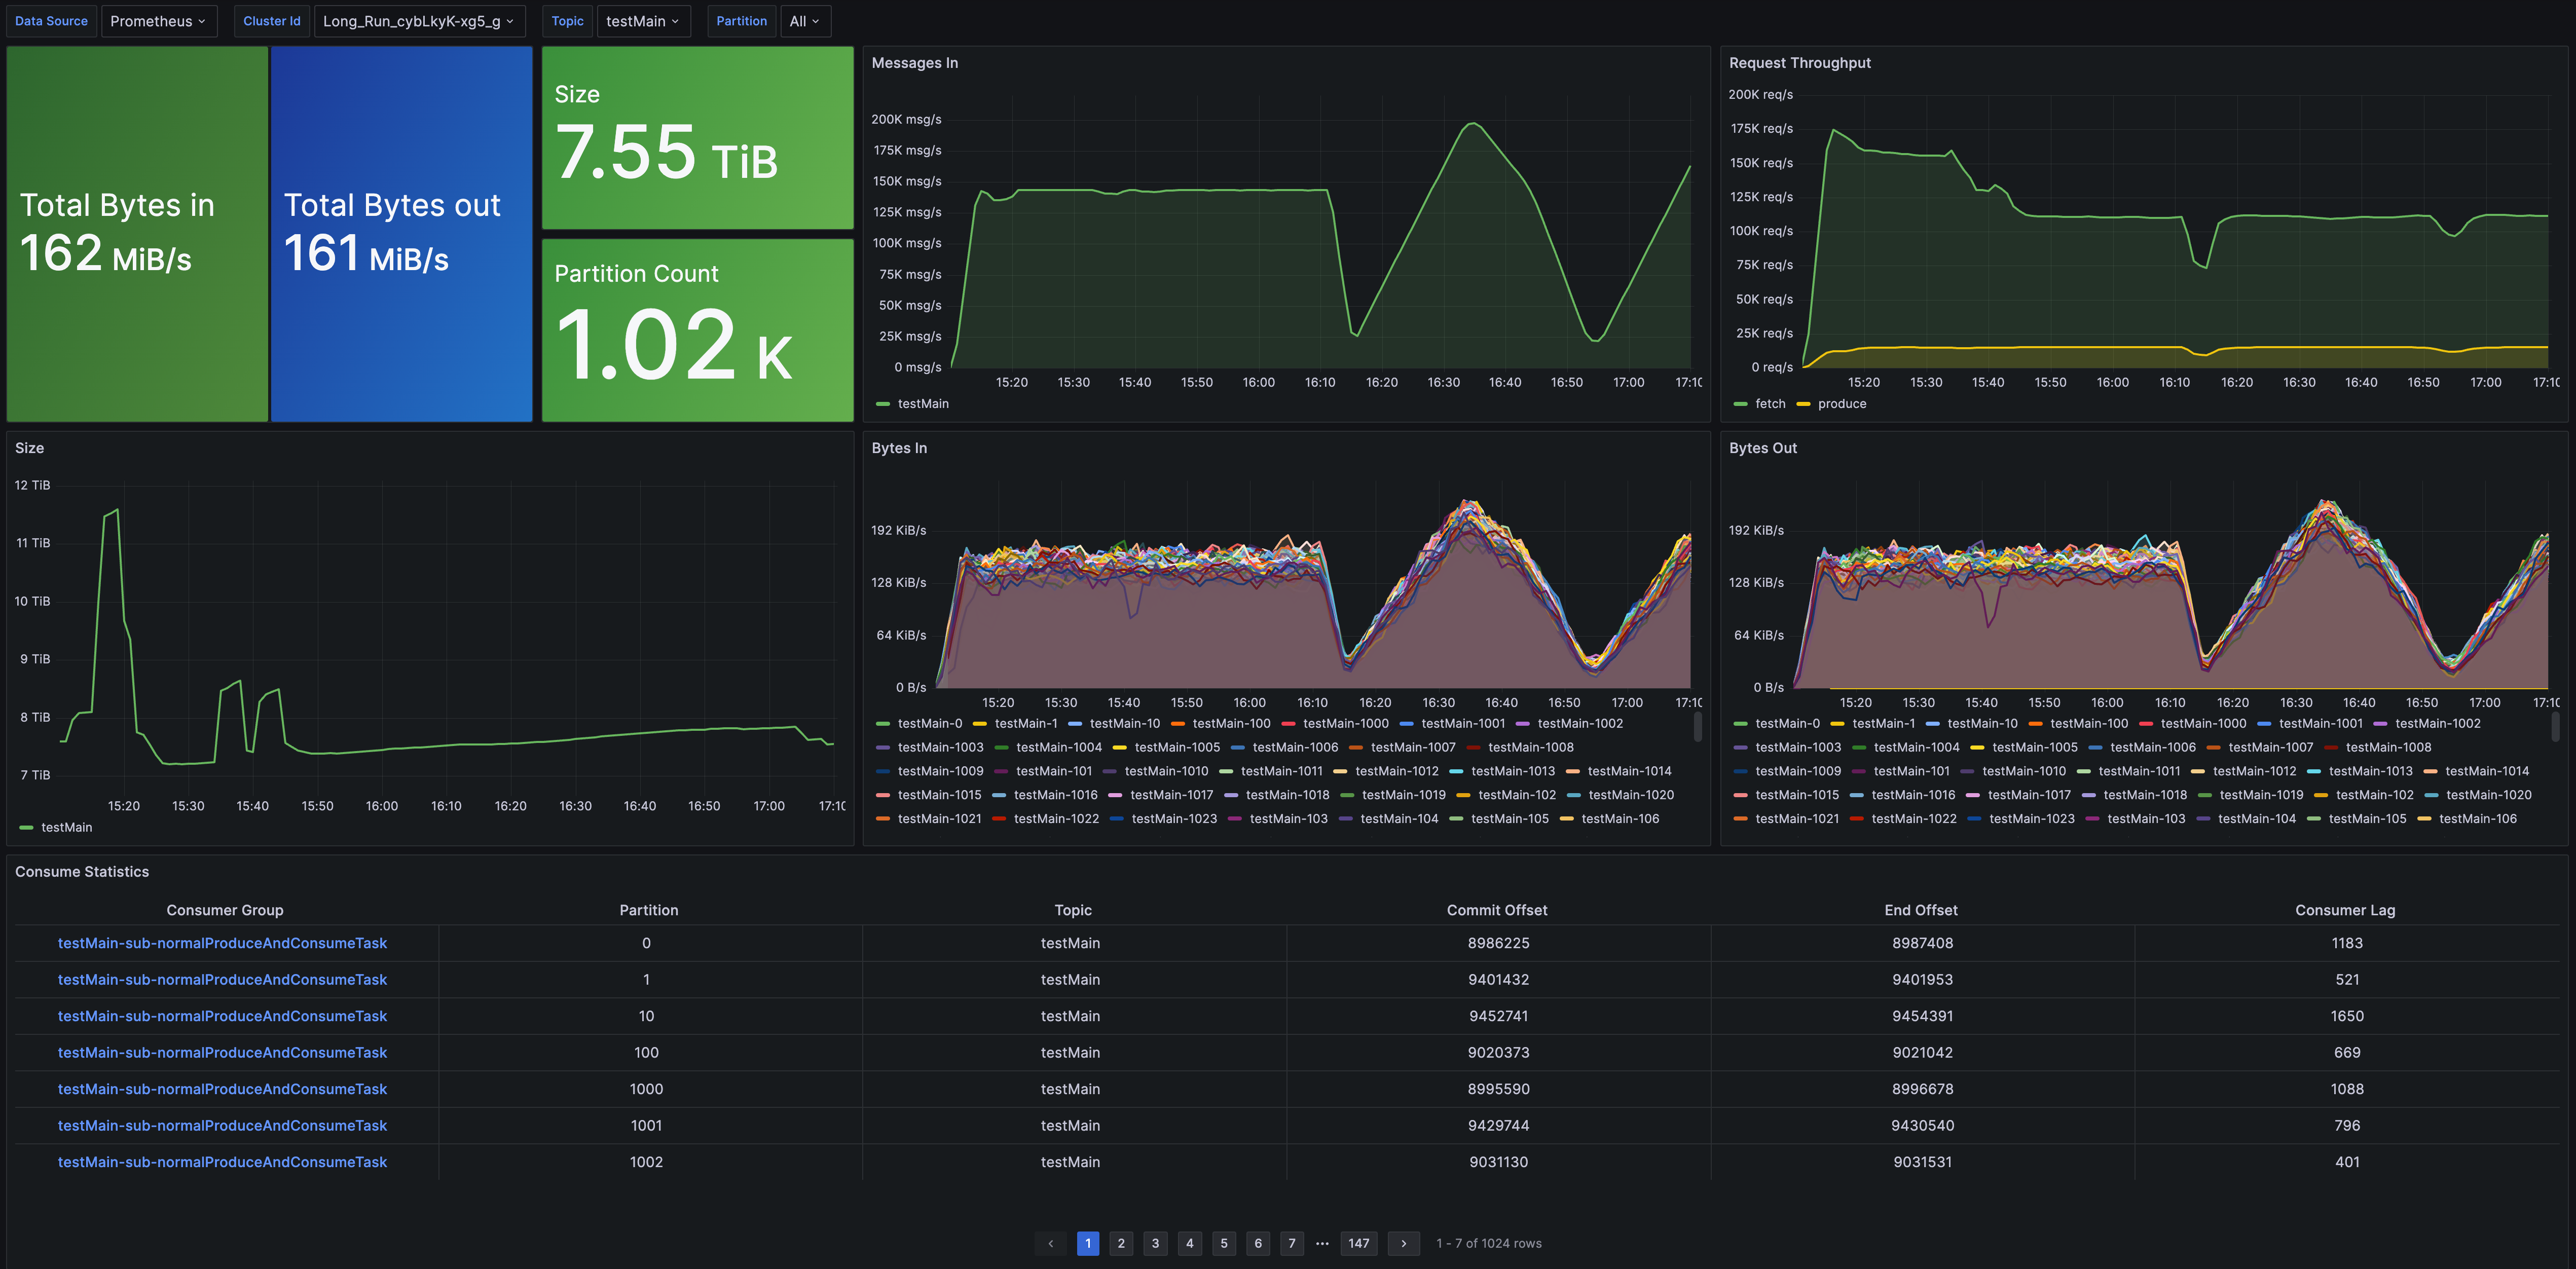
- Topic Metrics: This dashboard focuses on monitoring for Topics, featuring metrics such as message throughput, total data volume, number of partitions, and consumption latency.
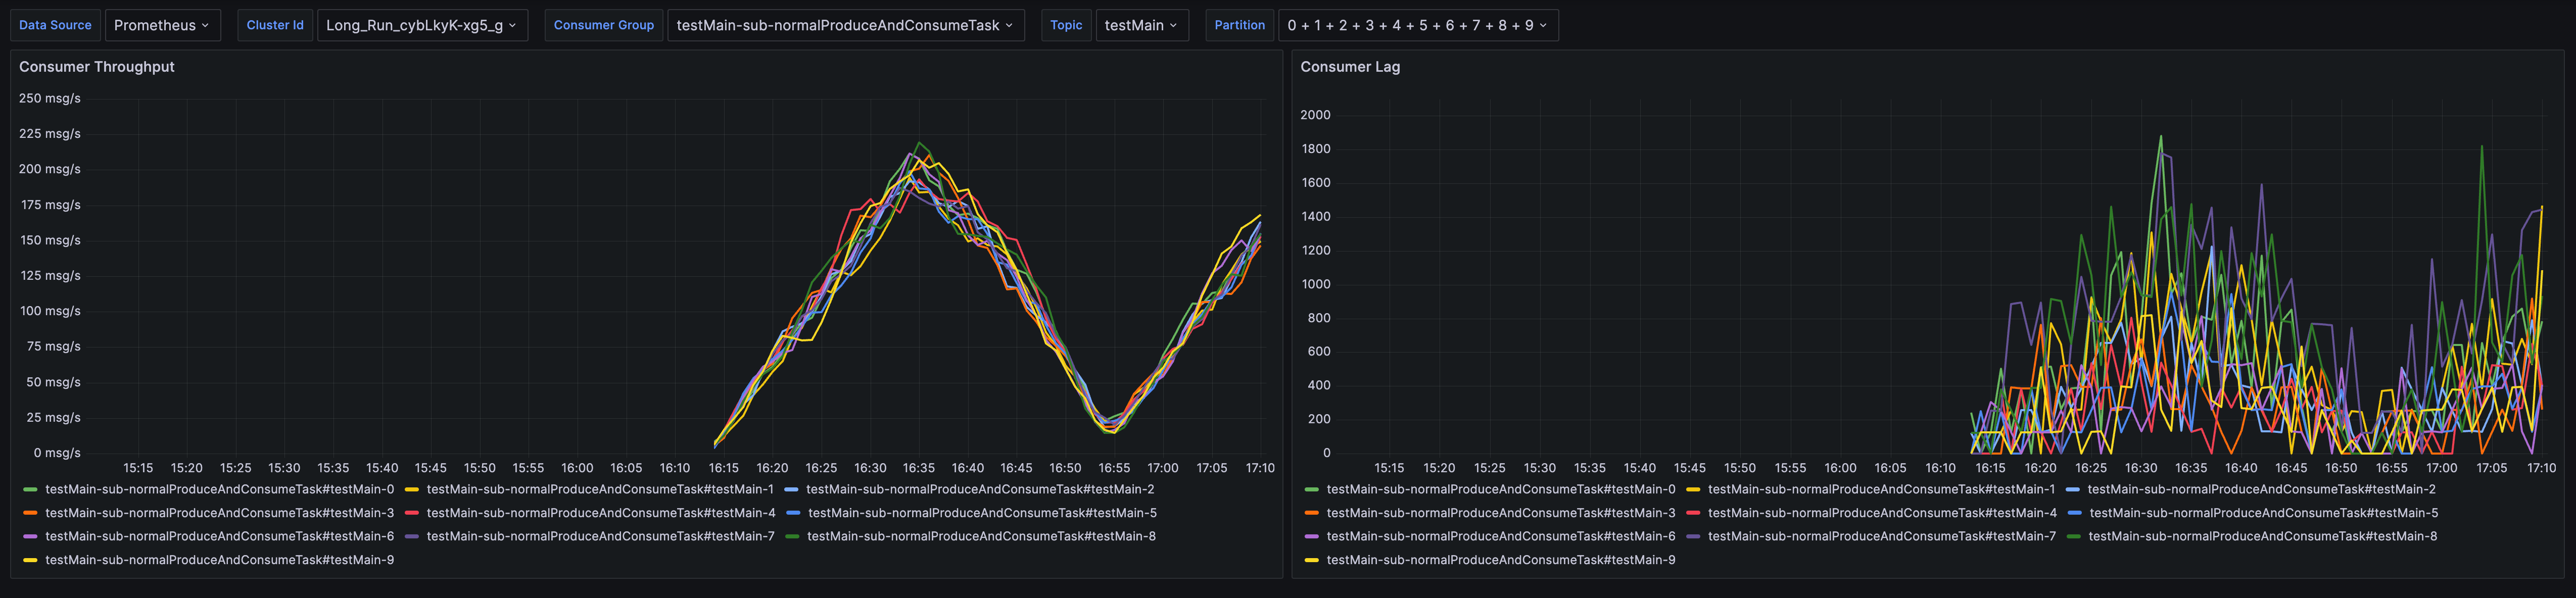
- Group Metrics: This dashboard is tailored for monitoring Groups, providing insights into consumption rate and consumption latency.
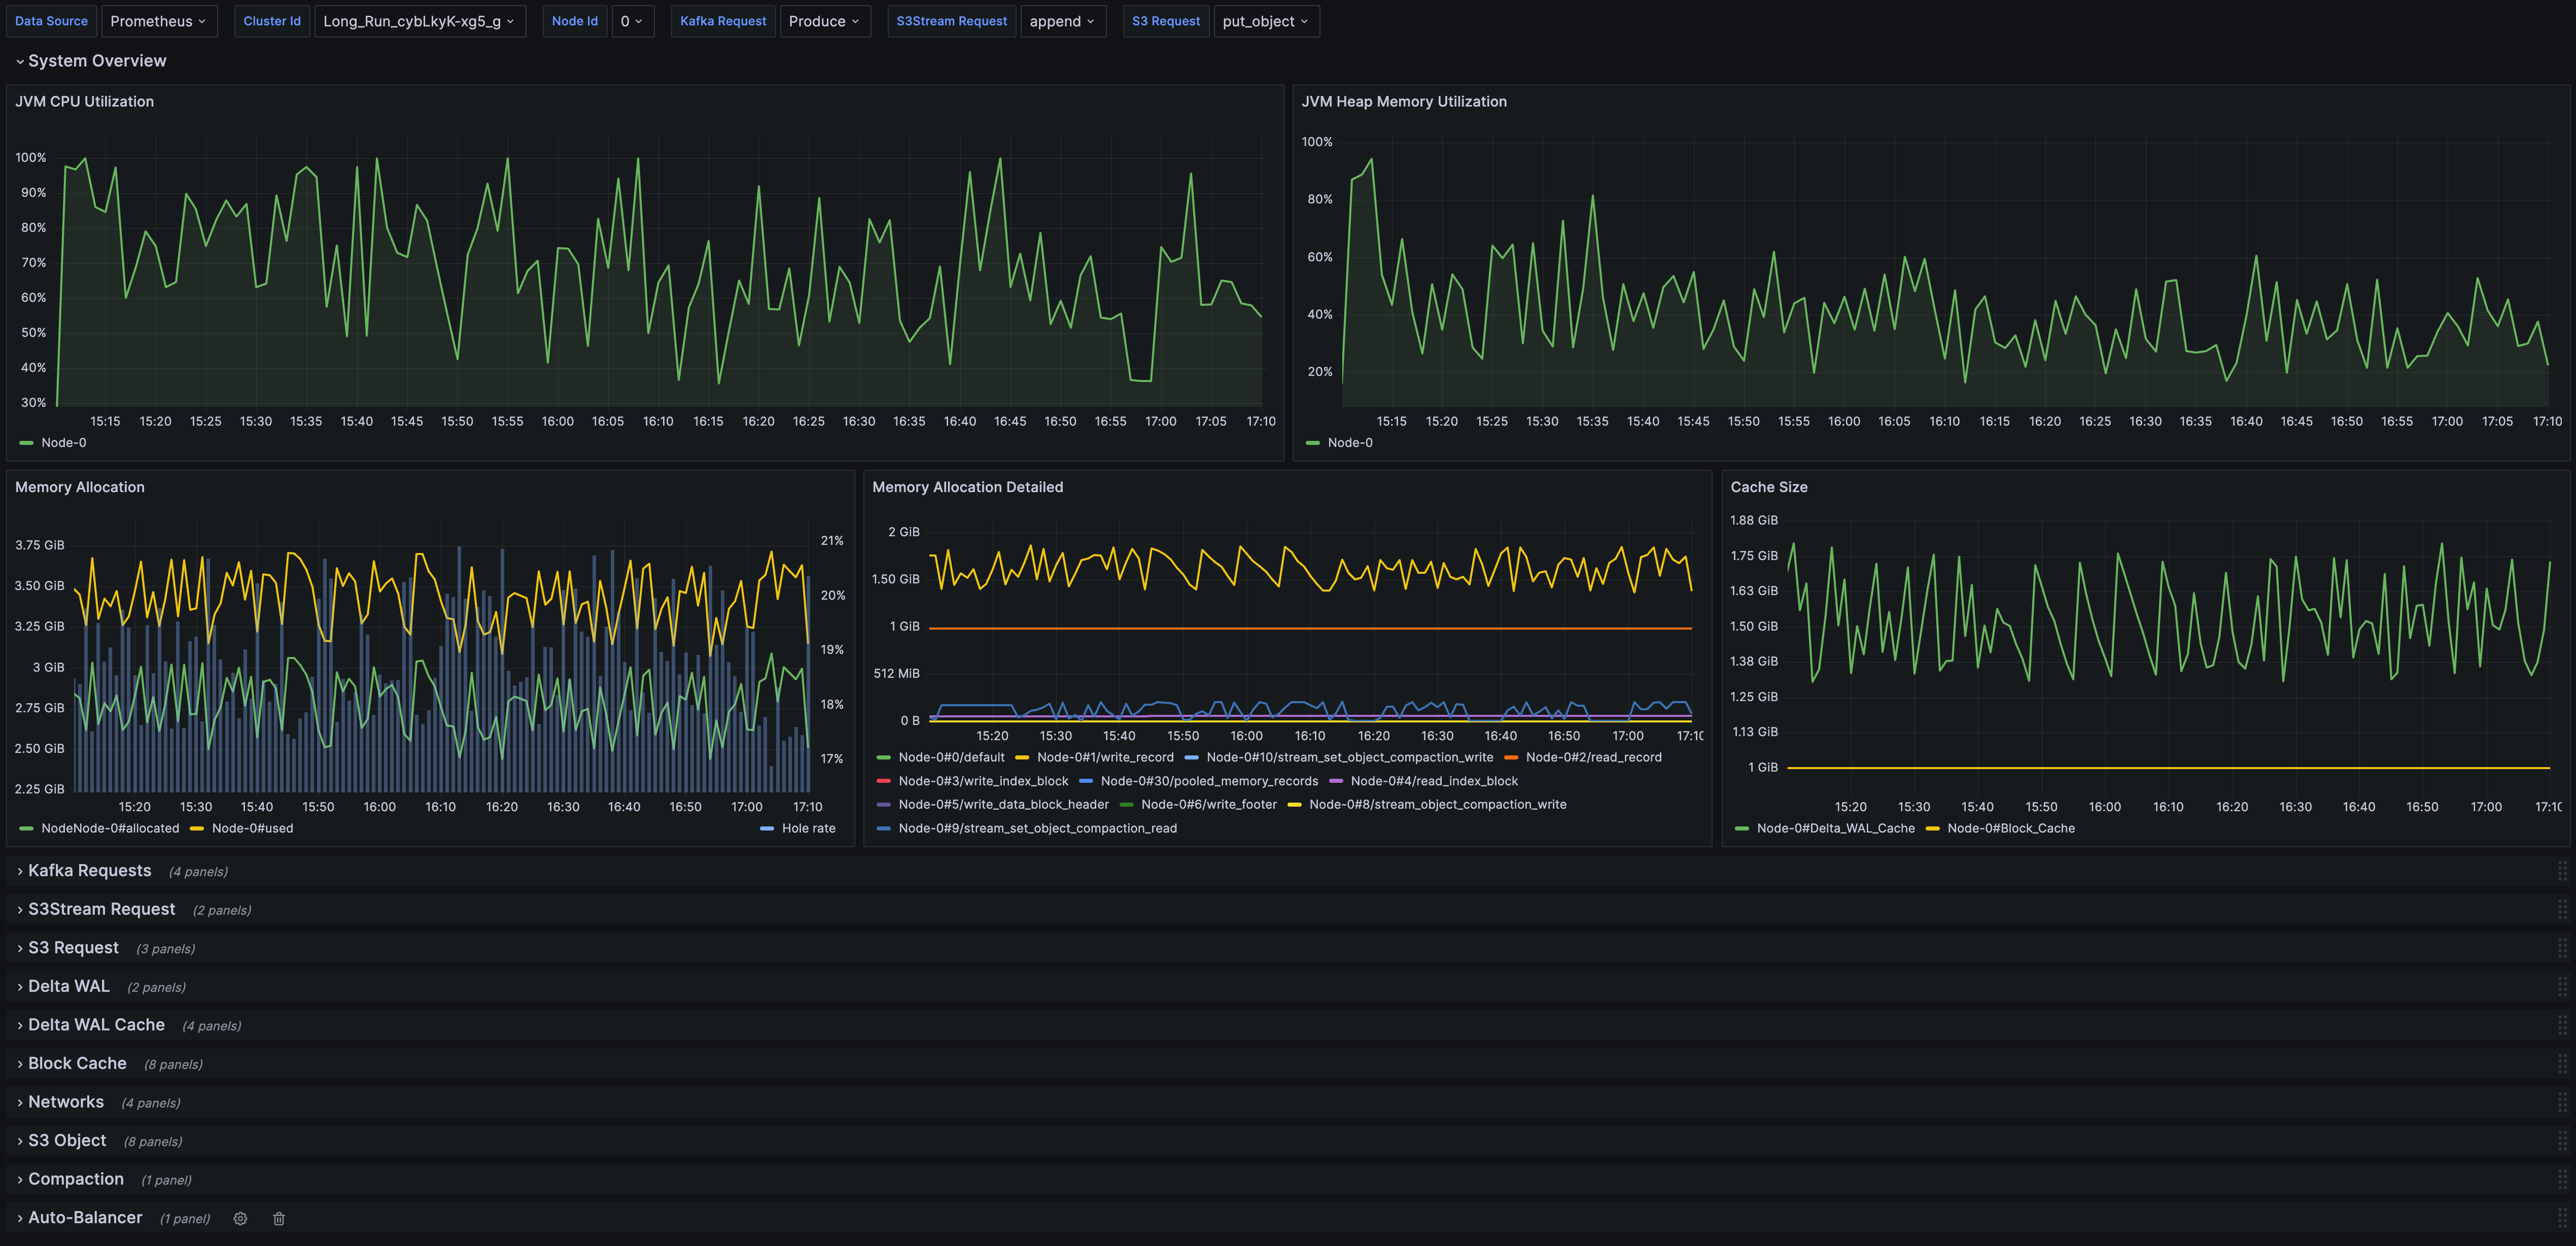
- Detailed Metrics: This dashboard offers comprehensive monitoring of implementation-level metrics, aiding developers in troubleshooting or achieving a deeper understanding of AutoMQ's operational dynamics.