Monitoring AutoMQ for Kafka
Metrics are essential analytical tools for system observability. AutoMQ for Kafka facilitates access to a wide array of native Apache Kafka® Metrics. This article elaborates on the Metrics available through AutoMQ Kafka Cloud.
Principles of Metrics Collection and Application
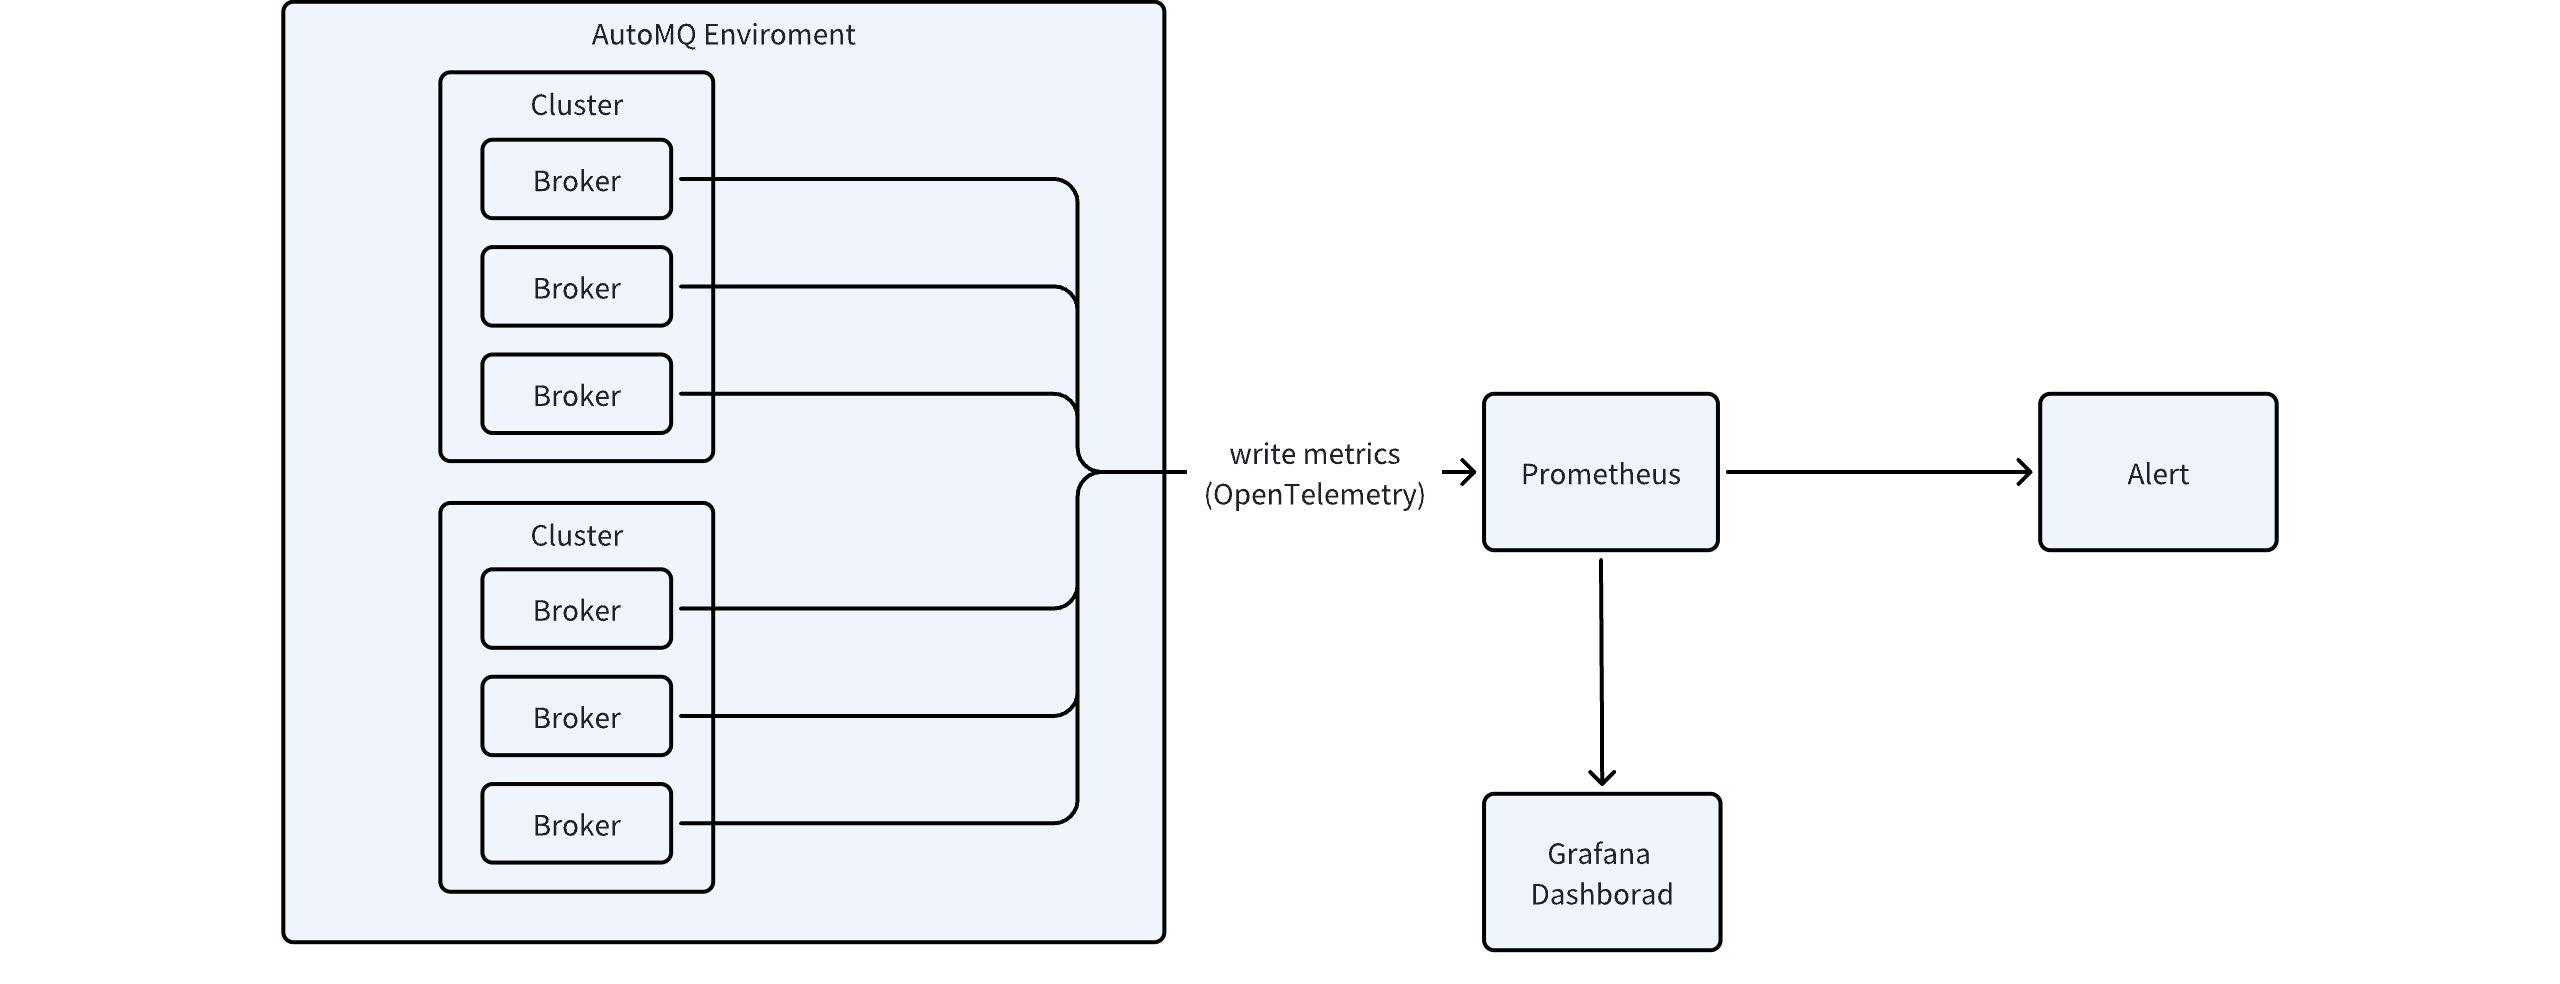
The internal components of AutoMQ Kafka Cloud enable the gathering of various Metrics data from the Kafka Server, although the current commercial release has not yet implemented a built-in Metrics dashboard or monitoring alert functionalities. Users can develop custom Metrics monitoring and analysis solutions utilizing the integration features offered by AutoBoost, as depicted in the architectural diagram below:
Referencing the diagram above, the steps for implementing Metrics collection and analysis are outlined as follows:
Utilize the Metrics integration feature Manage Integrations▸ to route Metrics data to a designated Prometheus service.
Effortlessly configure dashboards within your Grafana cluster using the Grafana template provided by AutoMQ.
Expediently establish monitoring alerts with the Prometheus alert template available from AutoMQ, with pertinent alert templates accessible here.
Definition of AutoMQ Kafka Metrics
For a comprehensive list of the Metrics available in the integration mentioned above, please consult the AutoMQ for Kafka Metrics▸.
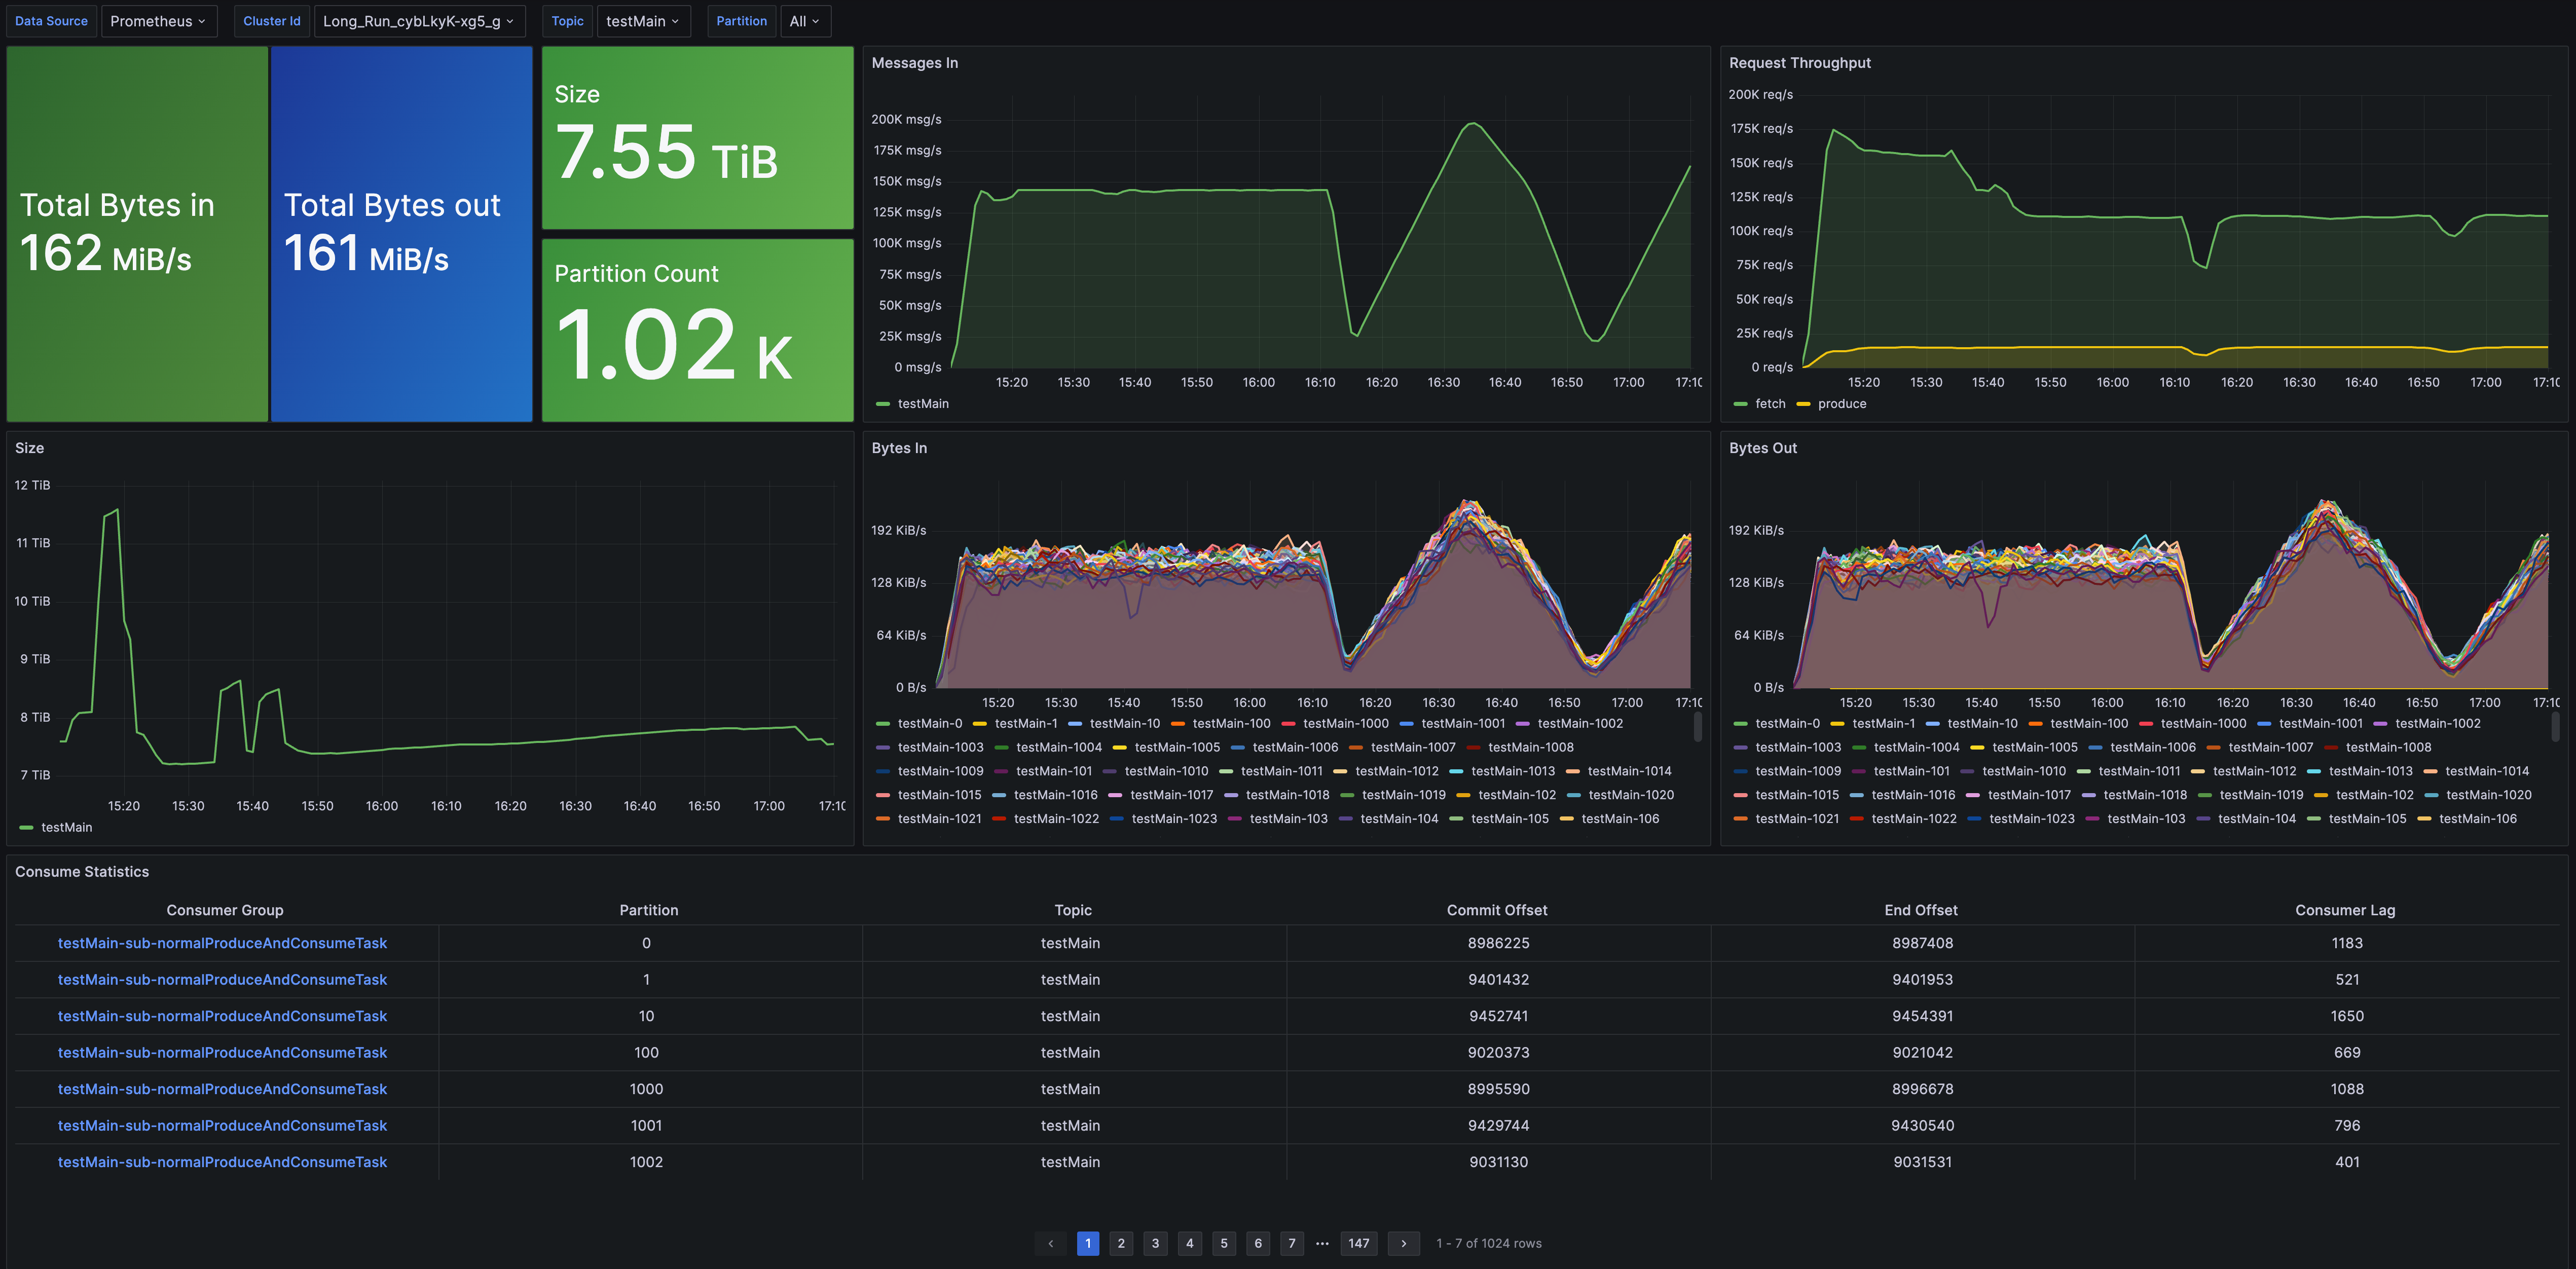
Example Grafana Dashboard
As noted earlier, AutoMQ Cloud does not currently provide a managed Grafana dashboard service. Instead, users can easily set up their own dashboards using the Grafana templates from AutoMQ. You can download the relevant dashboard templates at this link.
The provided Grafana dashboard templates enable monitoring across various dimensions:
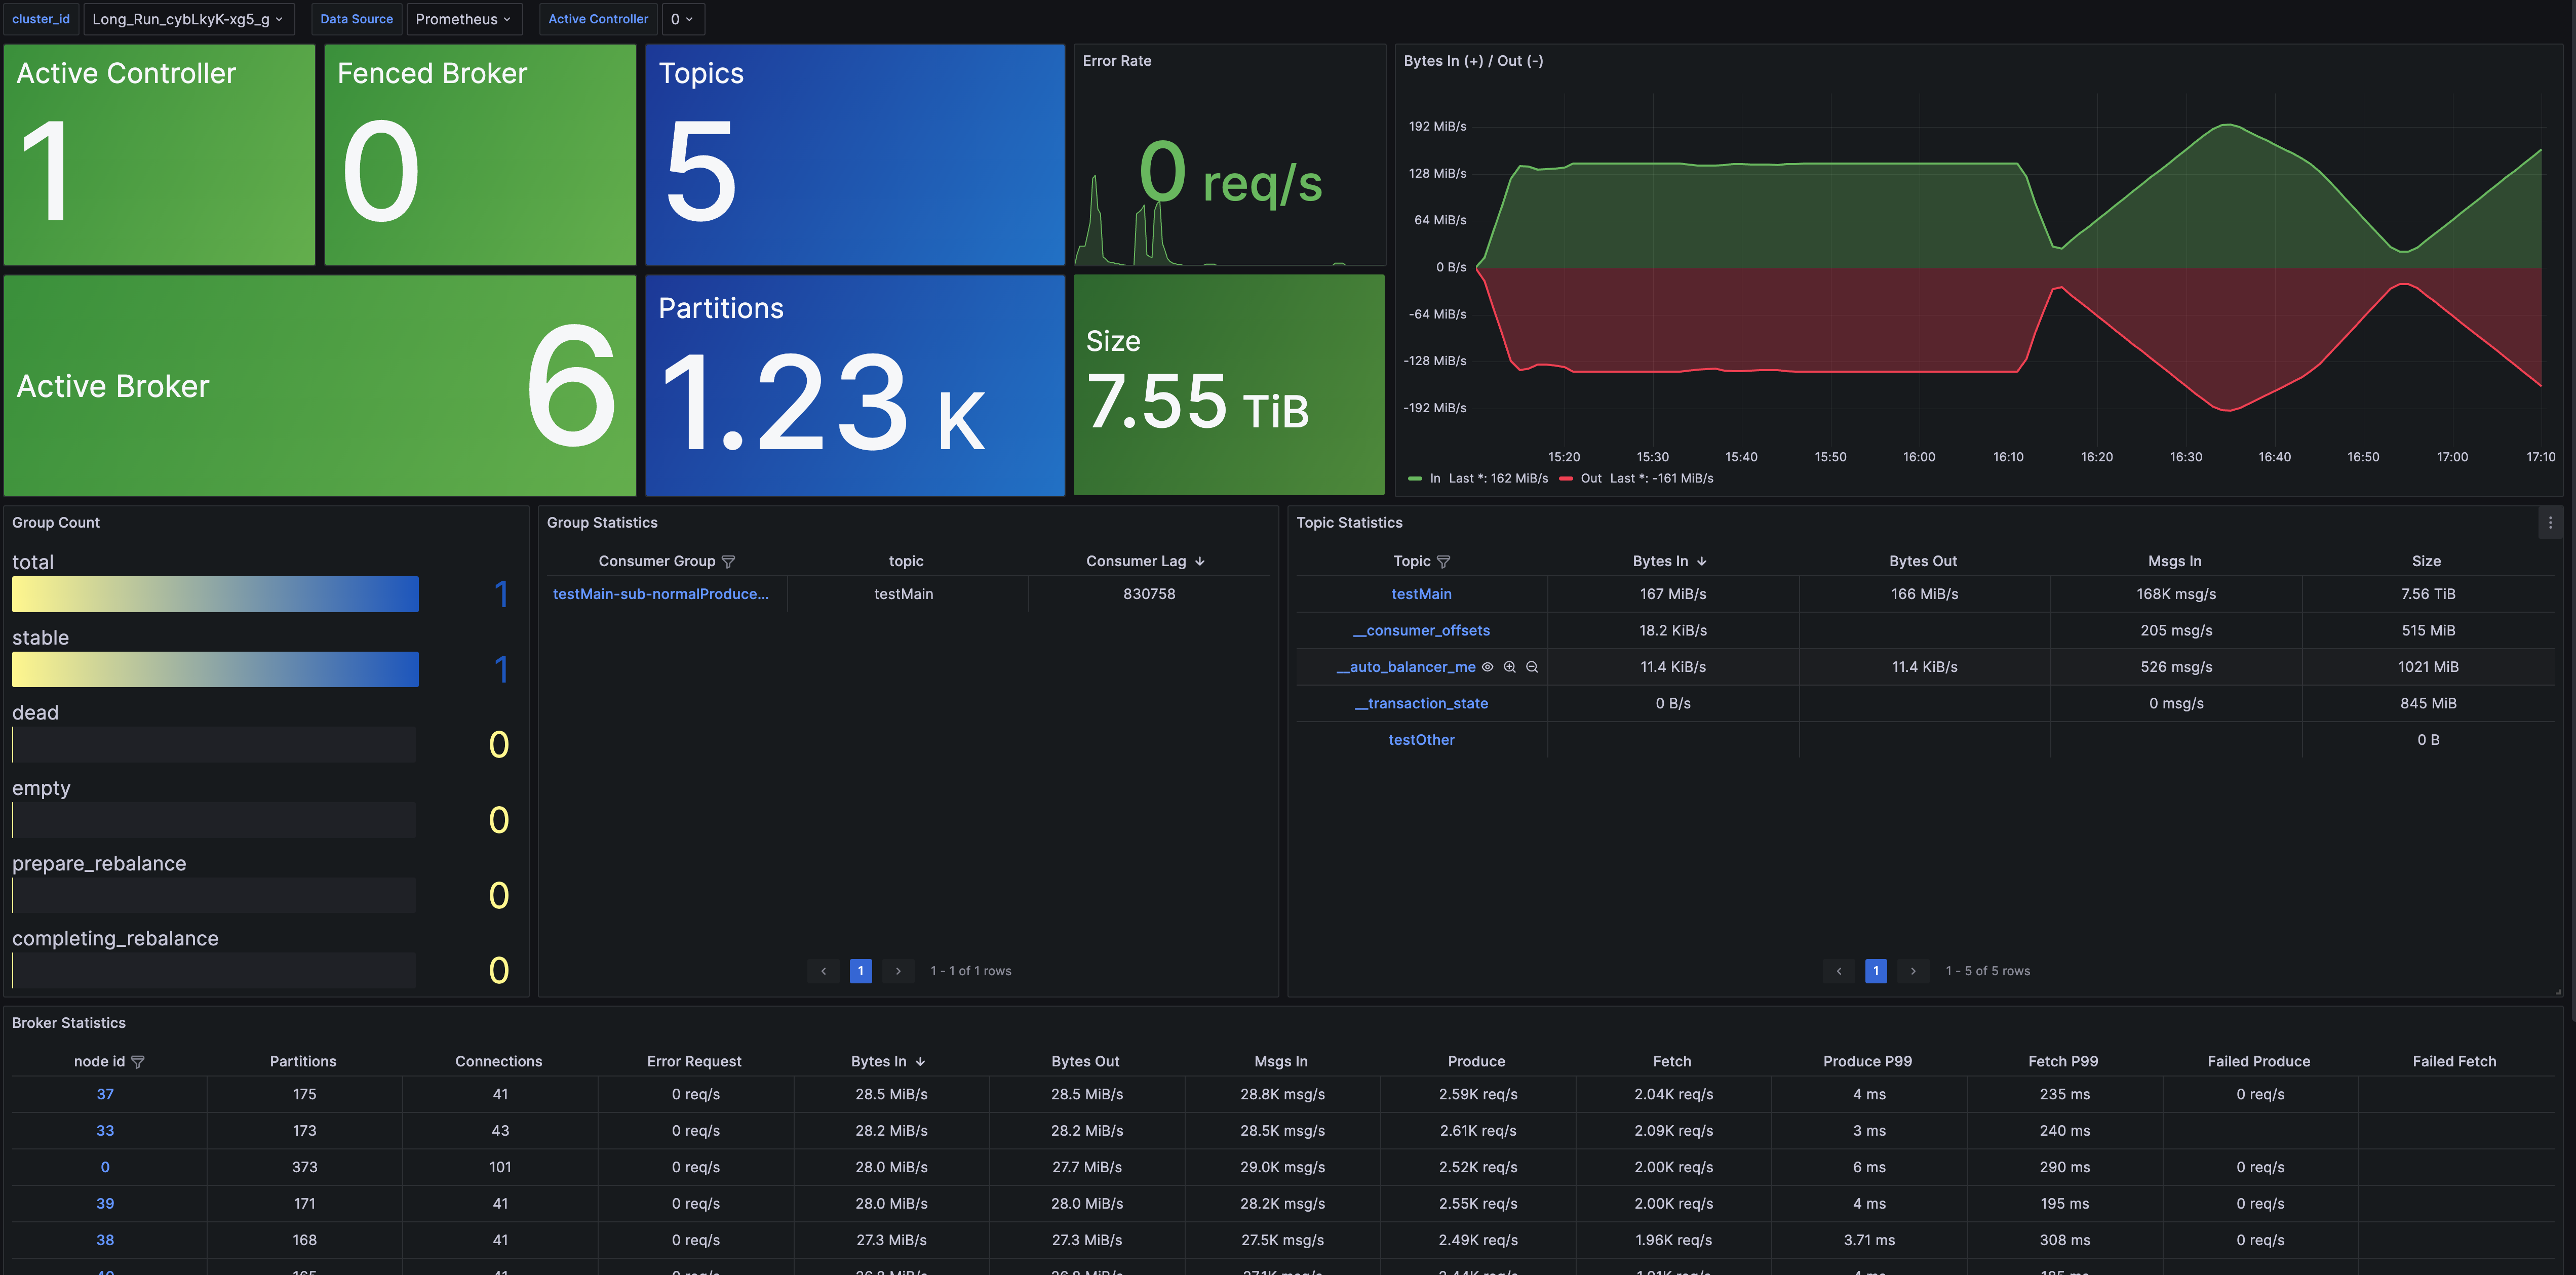
- Cluster Overview: This template offers cluster-level monitoring, tracking the number of nodes, data size, cluster traffic, and providing a breakdown of metrics by Topic, Group, and Broker dimensions, complete with in-depth monitoring capabilities.
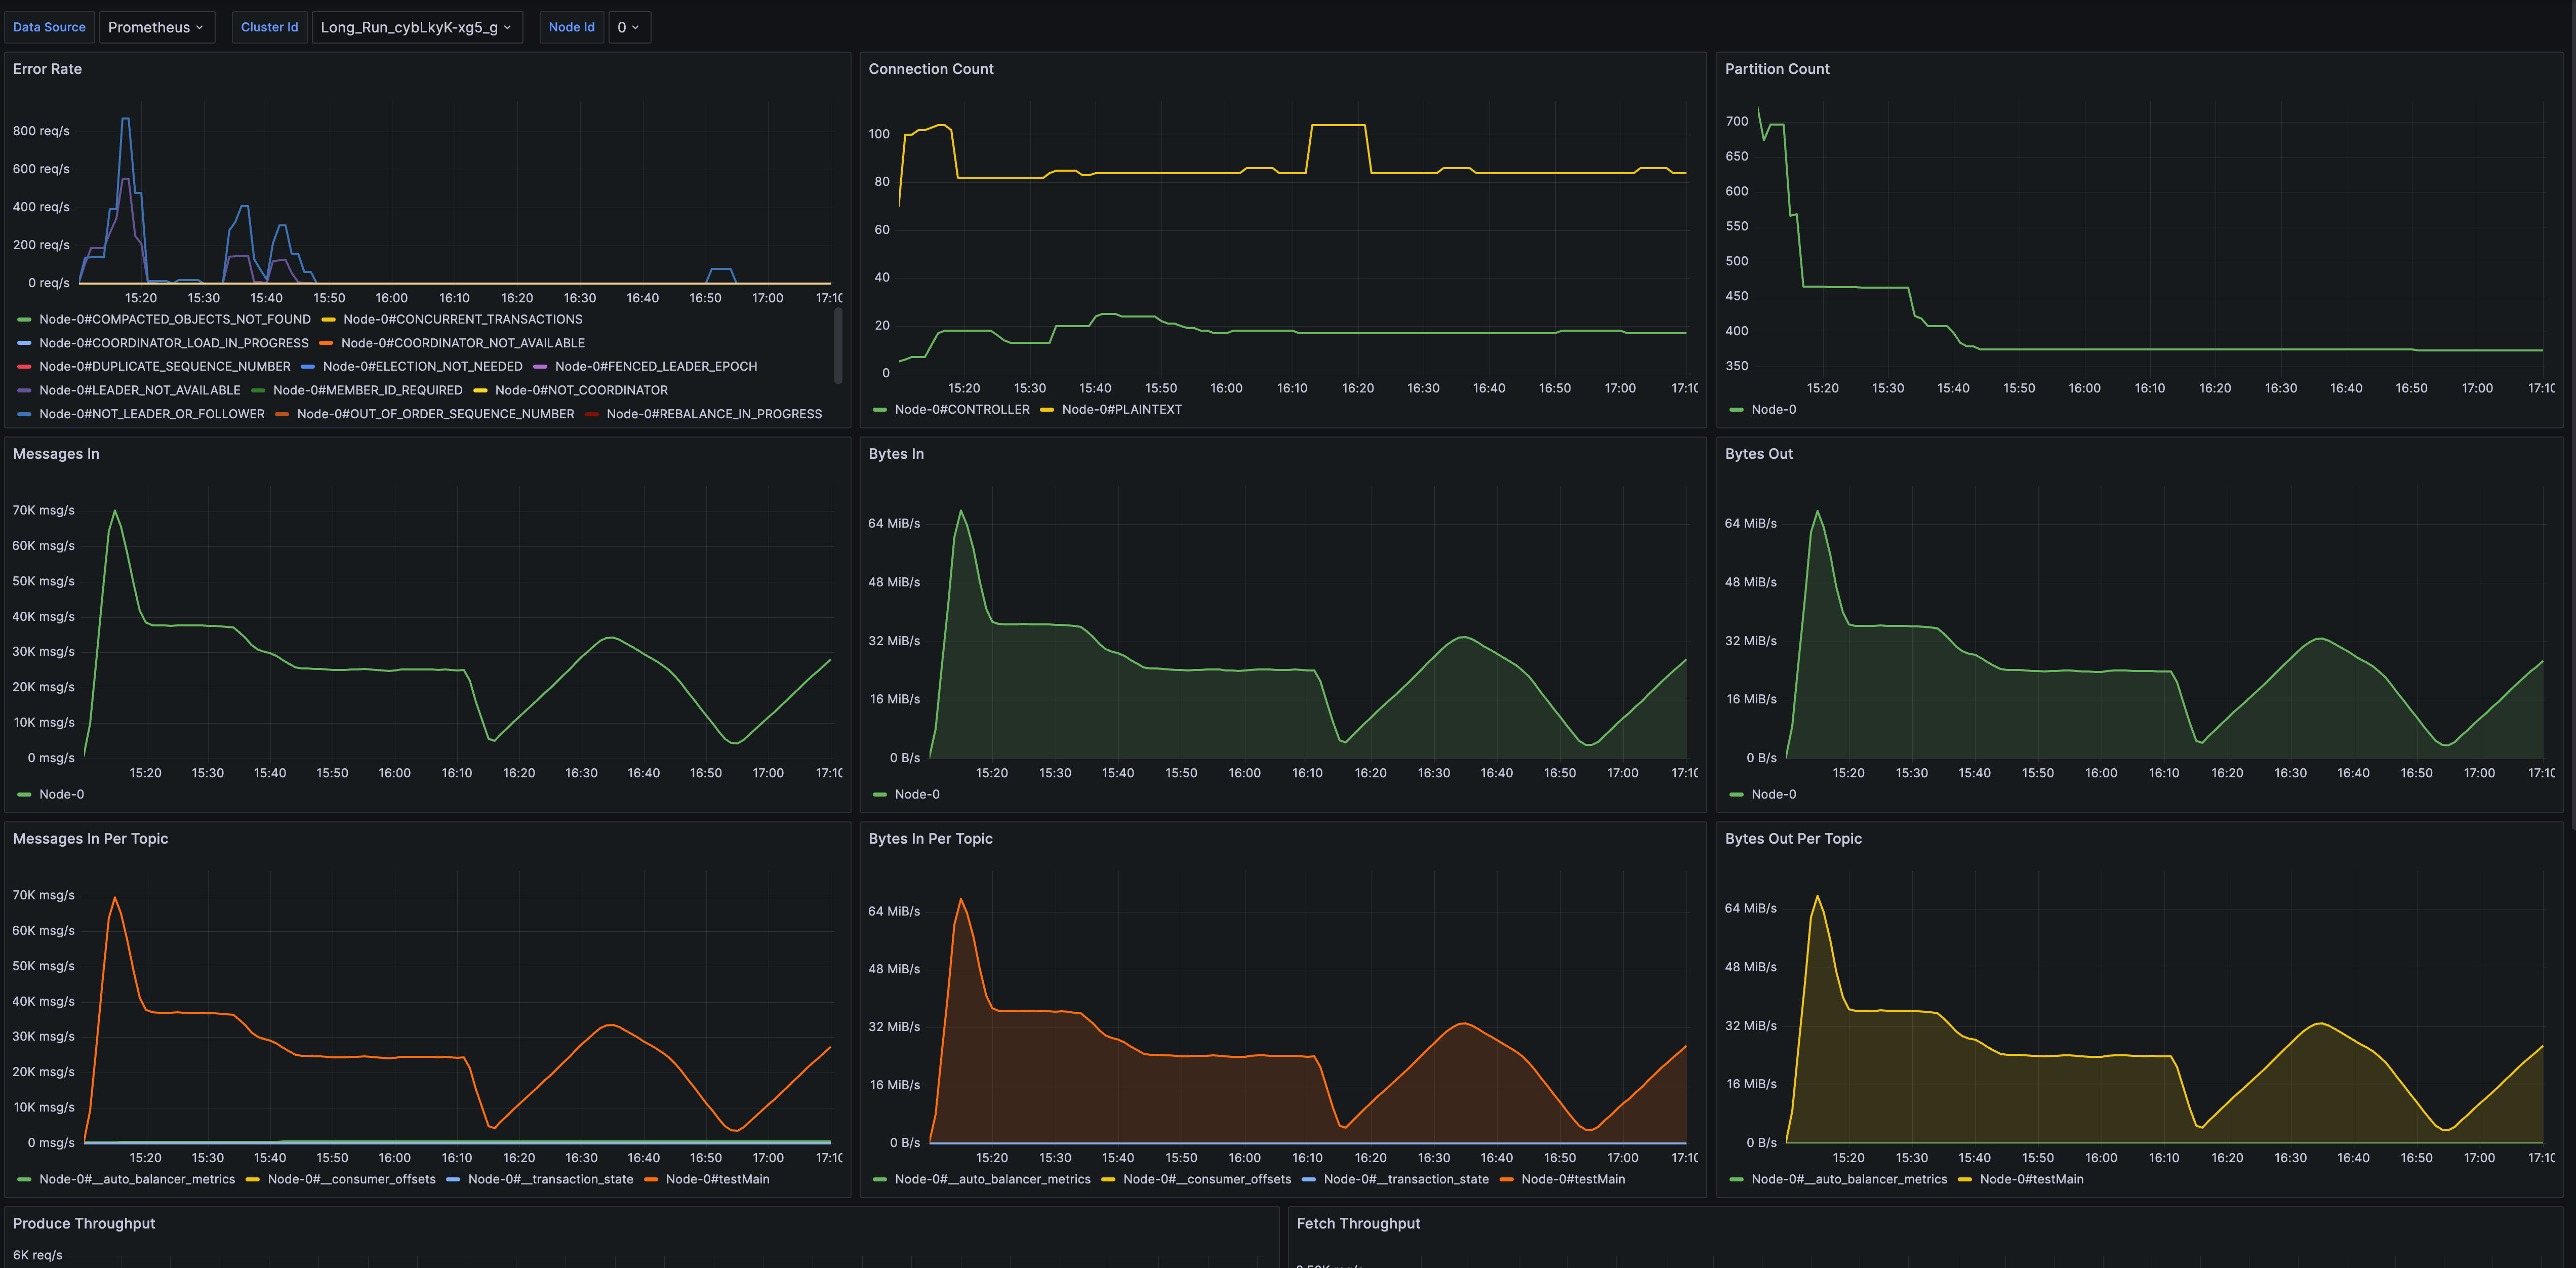
- Broker Metrics: This template monitors the Broker level, detailing the number of connections, the number of partitions, node traffic, and node requests.
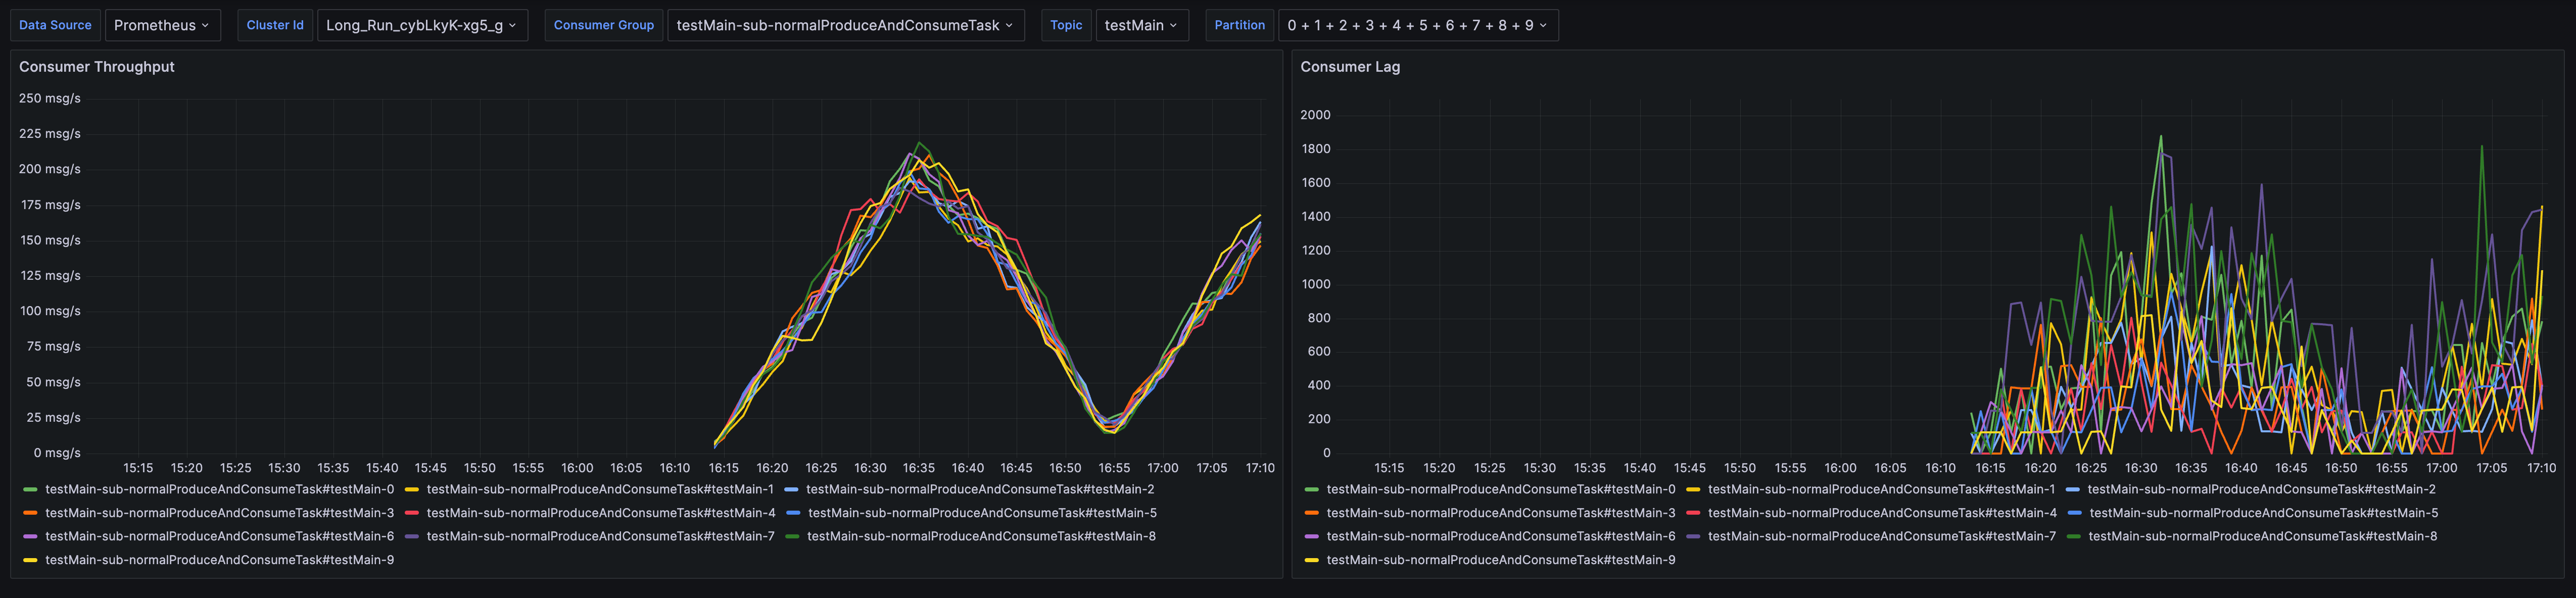
- Topic Metrics: Monitoring at the Topic level is covered here, including message throughput, total data volume, number of partitions, and consumption delay.
- Group Metrics: This template focuses on monitoring at the Group level, tracking consumption rate and consumption delay.