Prometheus 监控&报警
Metrics 是系统可观测非常重要的分析数据。AutoMQ 支持通过 Prometheus 透出原生 Apache Kafka 的多项 Metrics 数据。本文介绍 AutoMQ 透出的 Metrics 明细。
Metrics 采集、应用原理
AutoMQ 内部组件支持收集 Kafka Server 各项 Metrics 数据,但当前商业版本暂不提供内置的 Metrics 仪表盘和监控告警能力,用户可基于 AutoMQ 提供的集成功能实现自定义 Metrics 监控和分析,整体的架构参考下图:
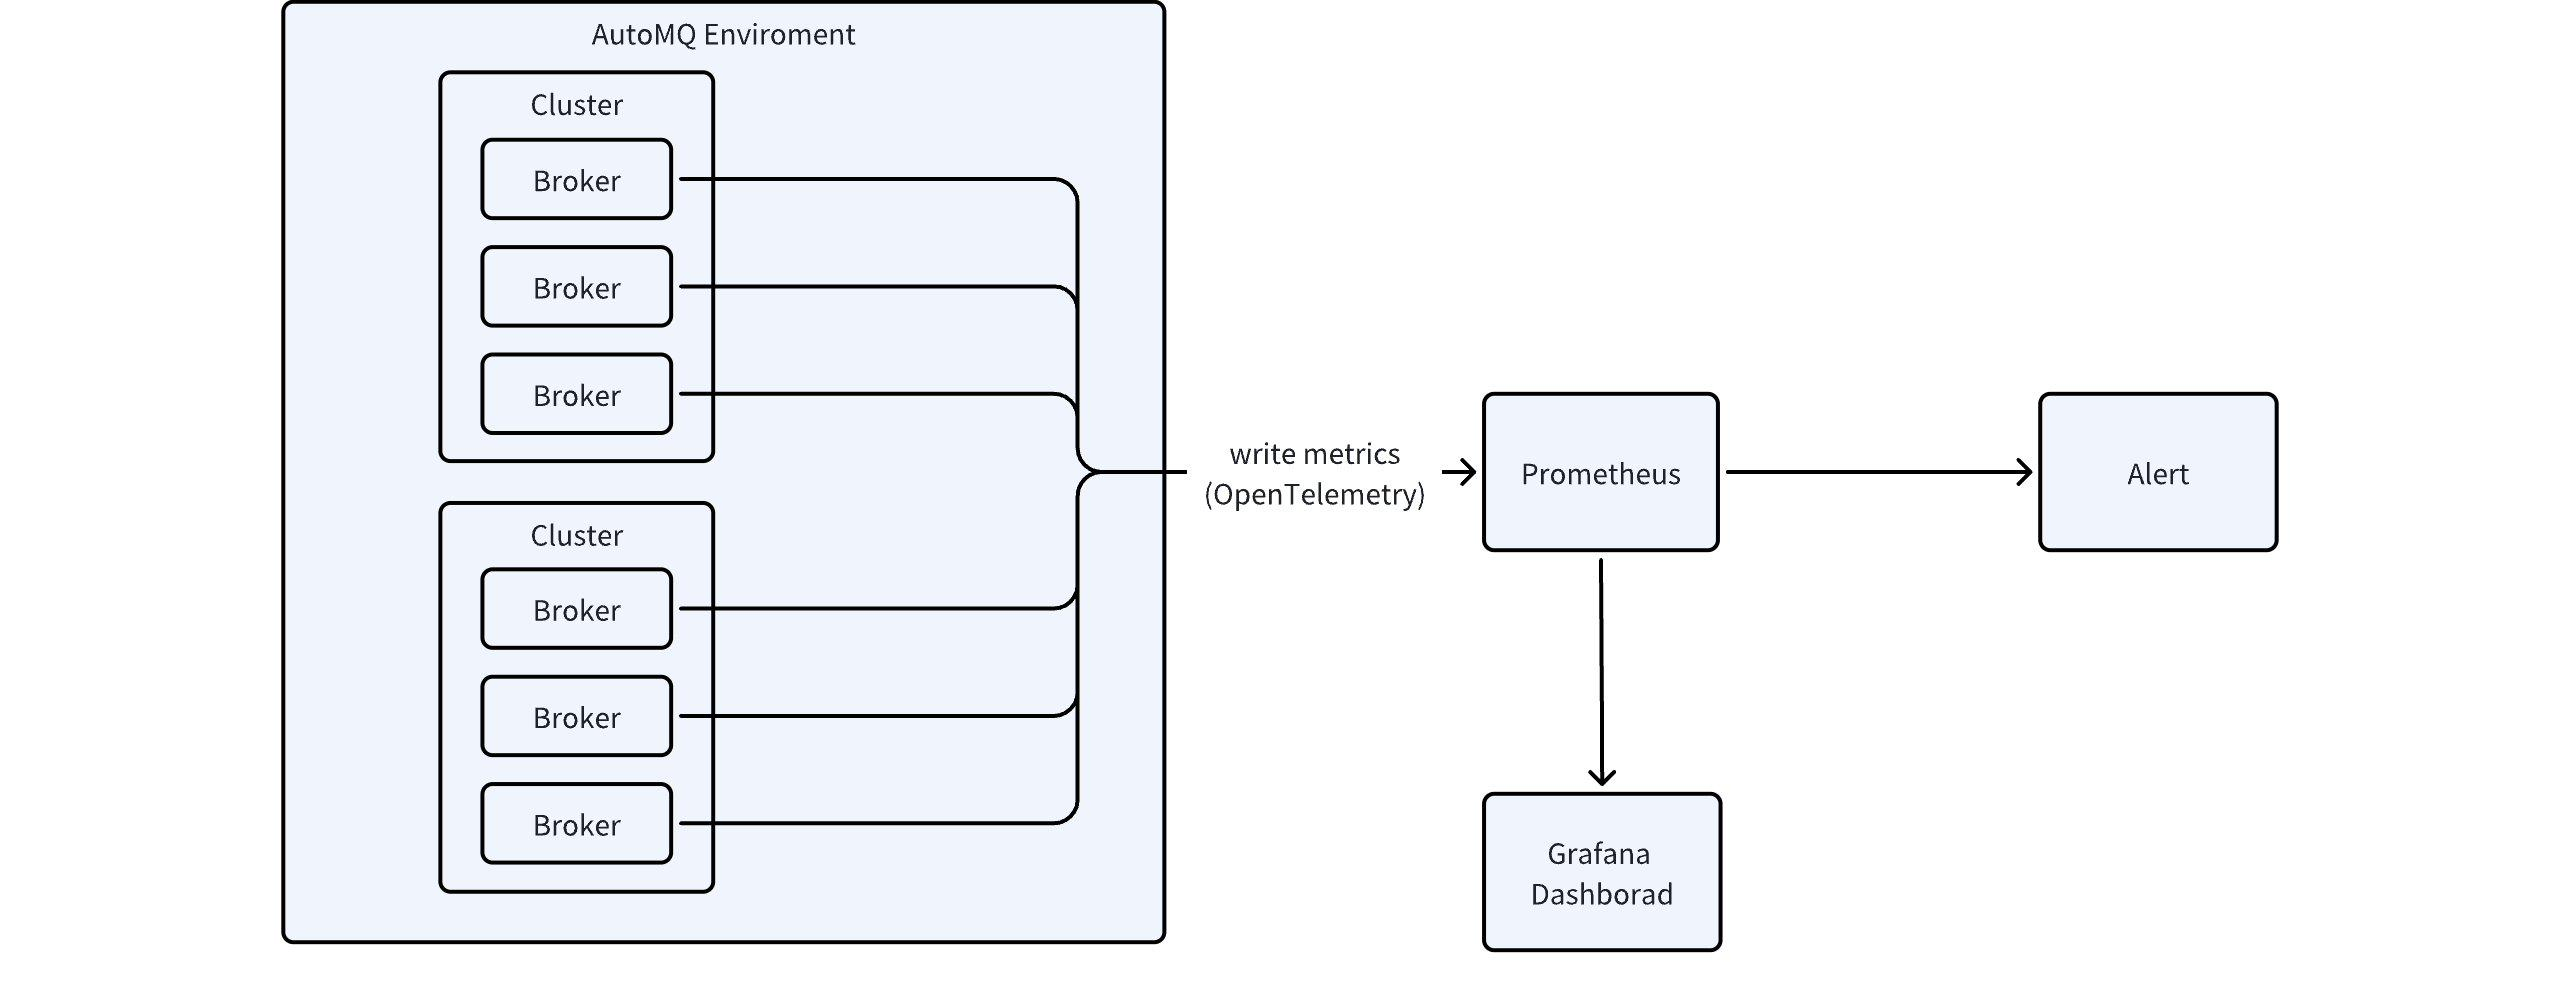
参考上图,应用 Metrics 采集和分析的步骤如下:
使用 Metrics 集成功能管理集成▸ 将 Metrics 数据转发到自定义的 Prometheus 服务。
使用 AutoMQ 提供的 Grafana 模板在用户的 Grafana 集群中快速配置仪表盘。
使用 AutoMQ 提供的 Prometheus 报警模板快速配置监控告警,相关报警模板参考链接。
Prometheus Metrics 定义
上述集成中透出的相关 Metrics 的详细定义请参考监控指标。
Grafana 仪表盘示例
如上文所述, AutoMQ Cloud 暂不提供托管的 Grafana 仪表盘服务,用户参考AutoMQ 提供的 Grafana 模板快速配置仪表盘,相关仪表盘模板请前往此处链接下载。
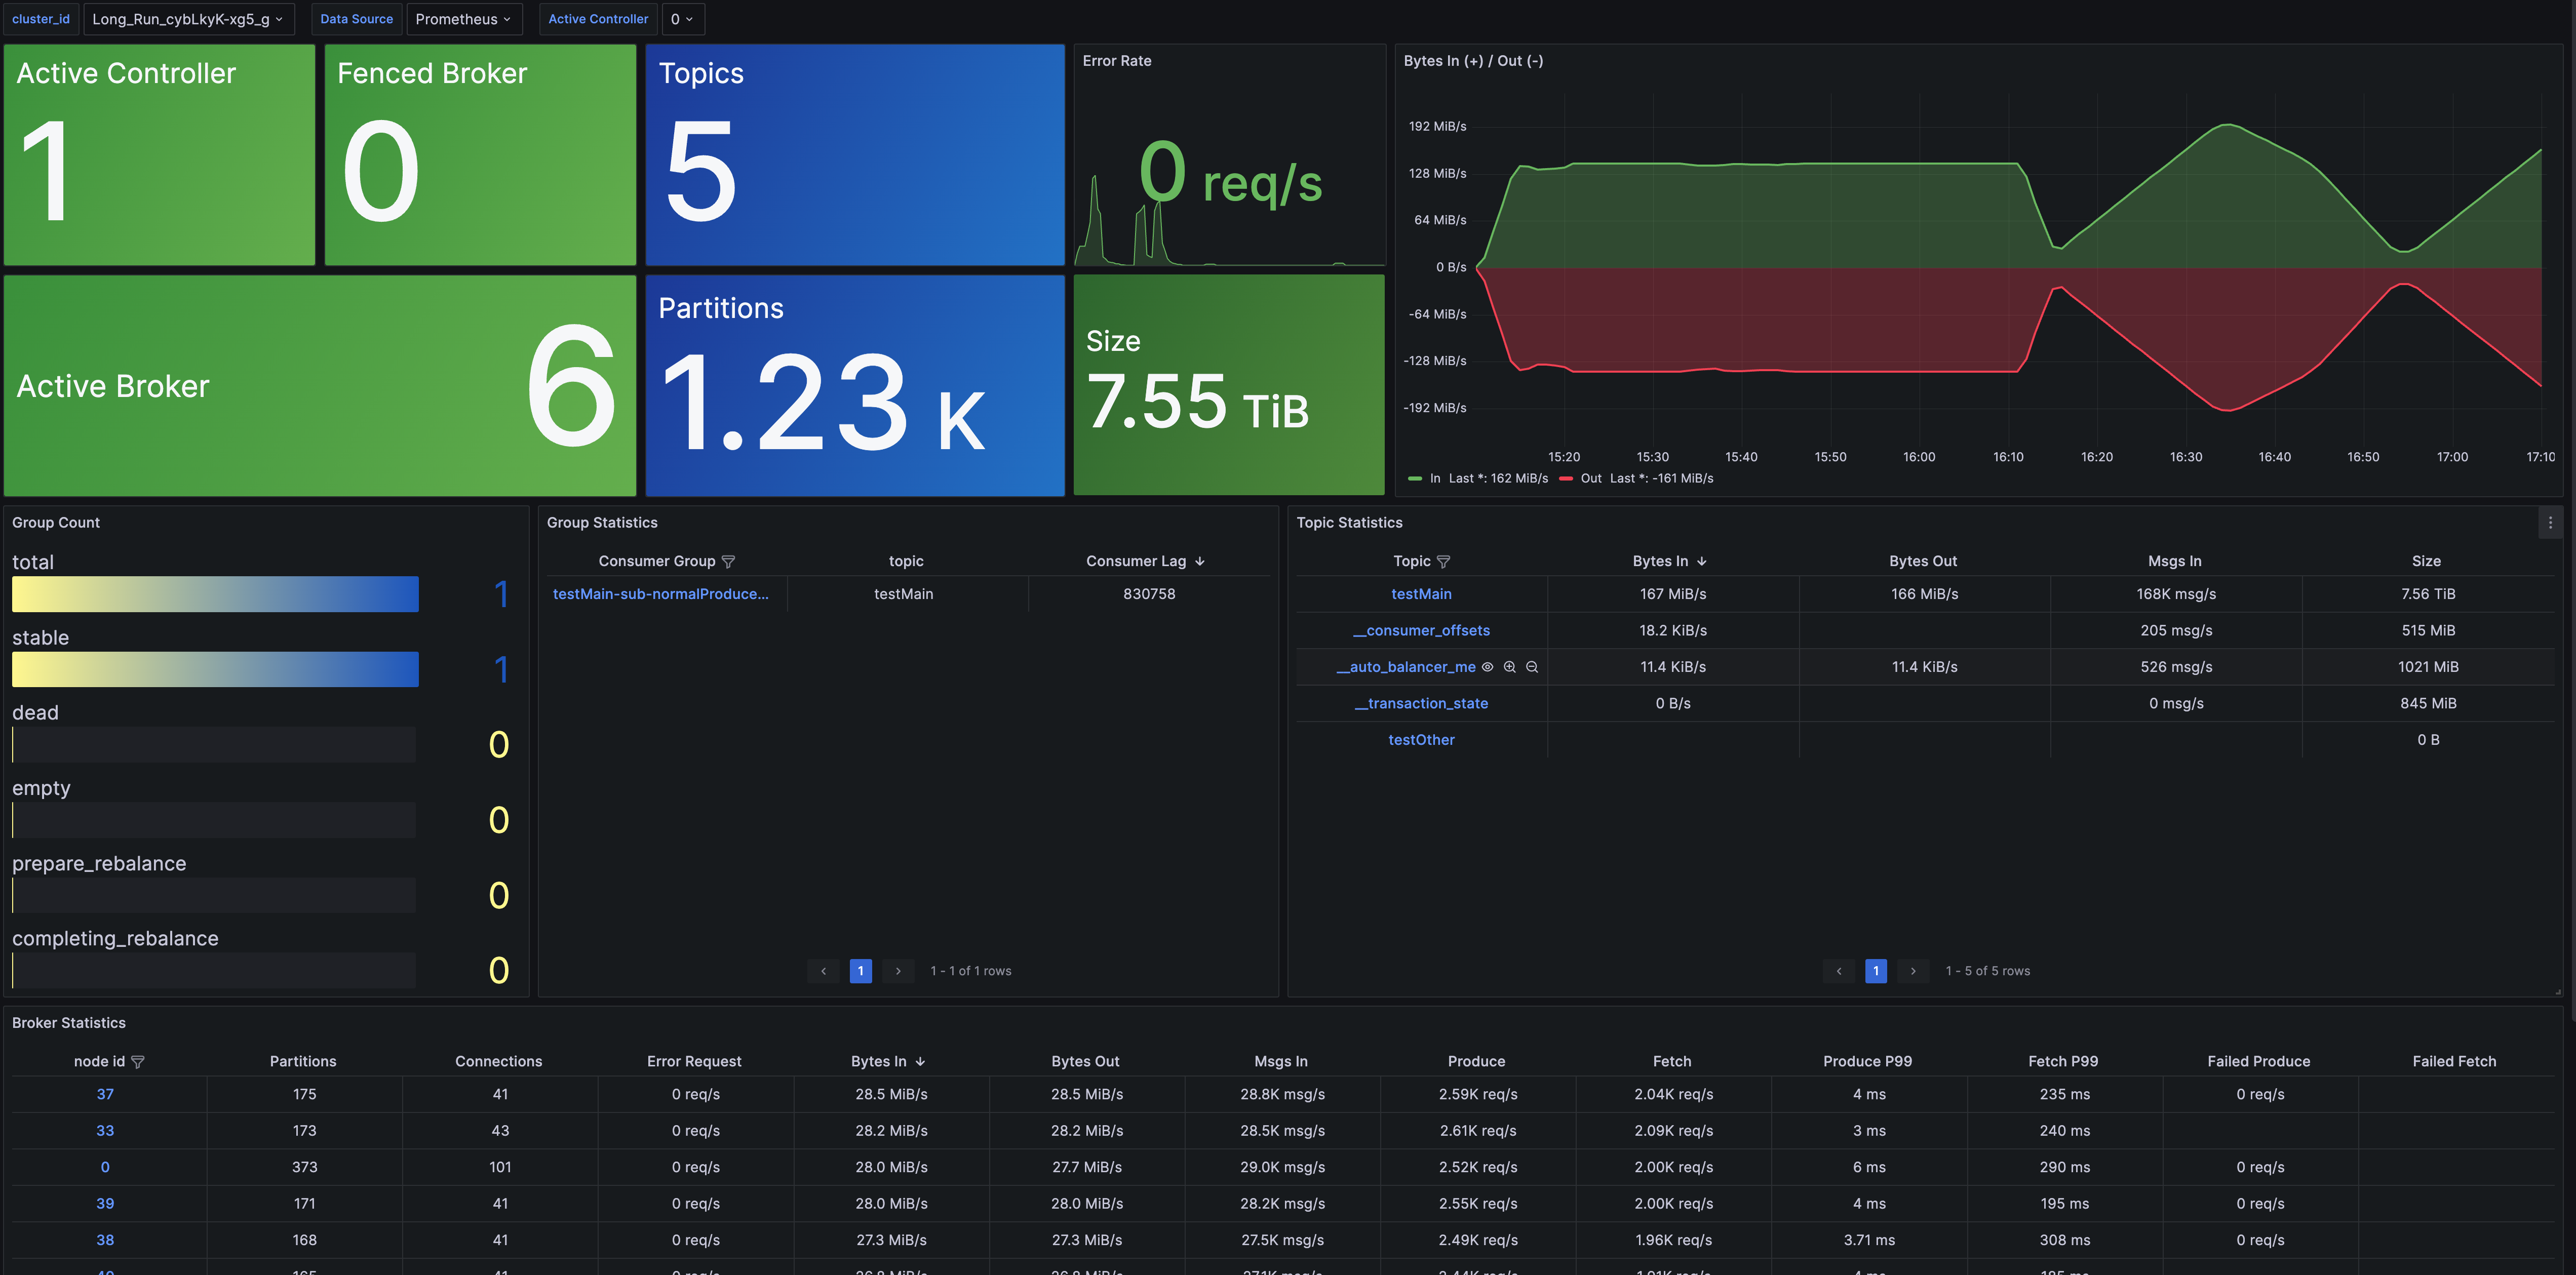
预置的 Grafana 大盘模板提供了不同维度的指标监控:
- Cluster Overview: 提供了集群维度的监控,包括节点数量、数据大小、集群流量等,以及Topic、Group、Broker 维度的指标概览,并提供了下钻功能,可跳转至对应的详情监控
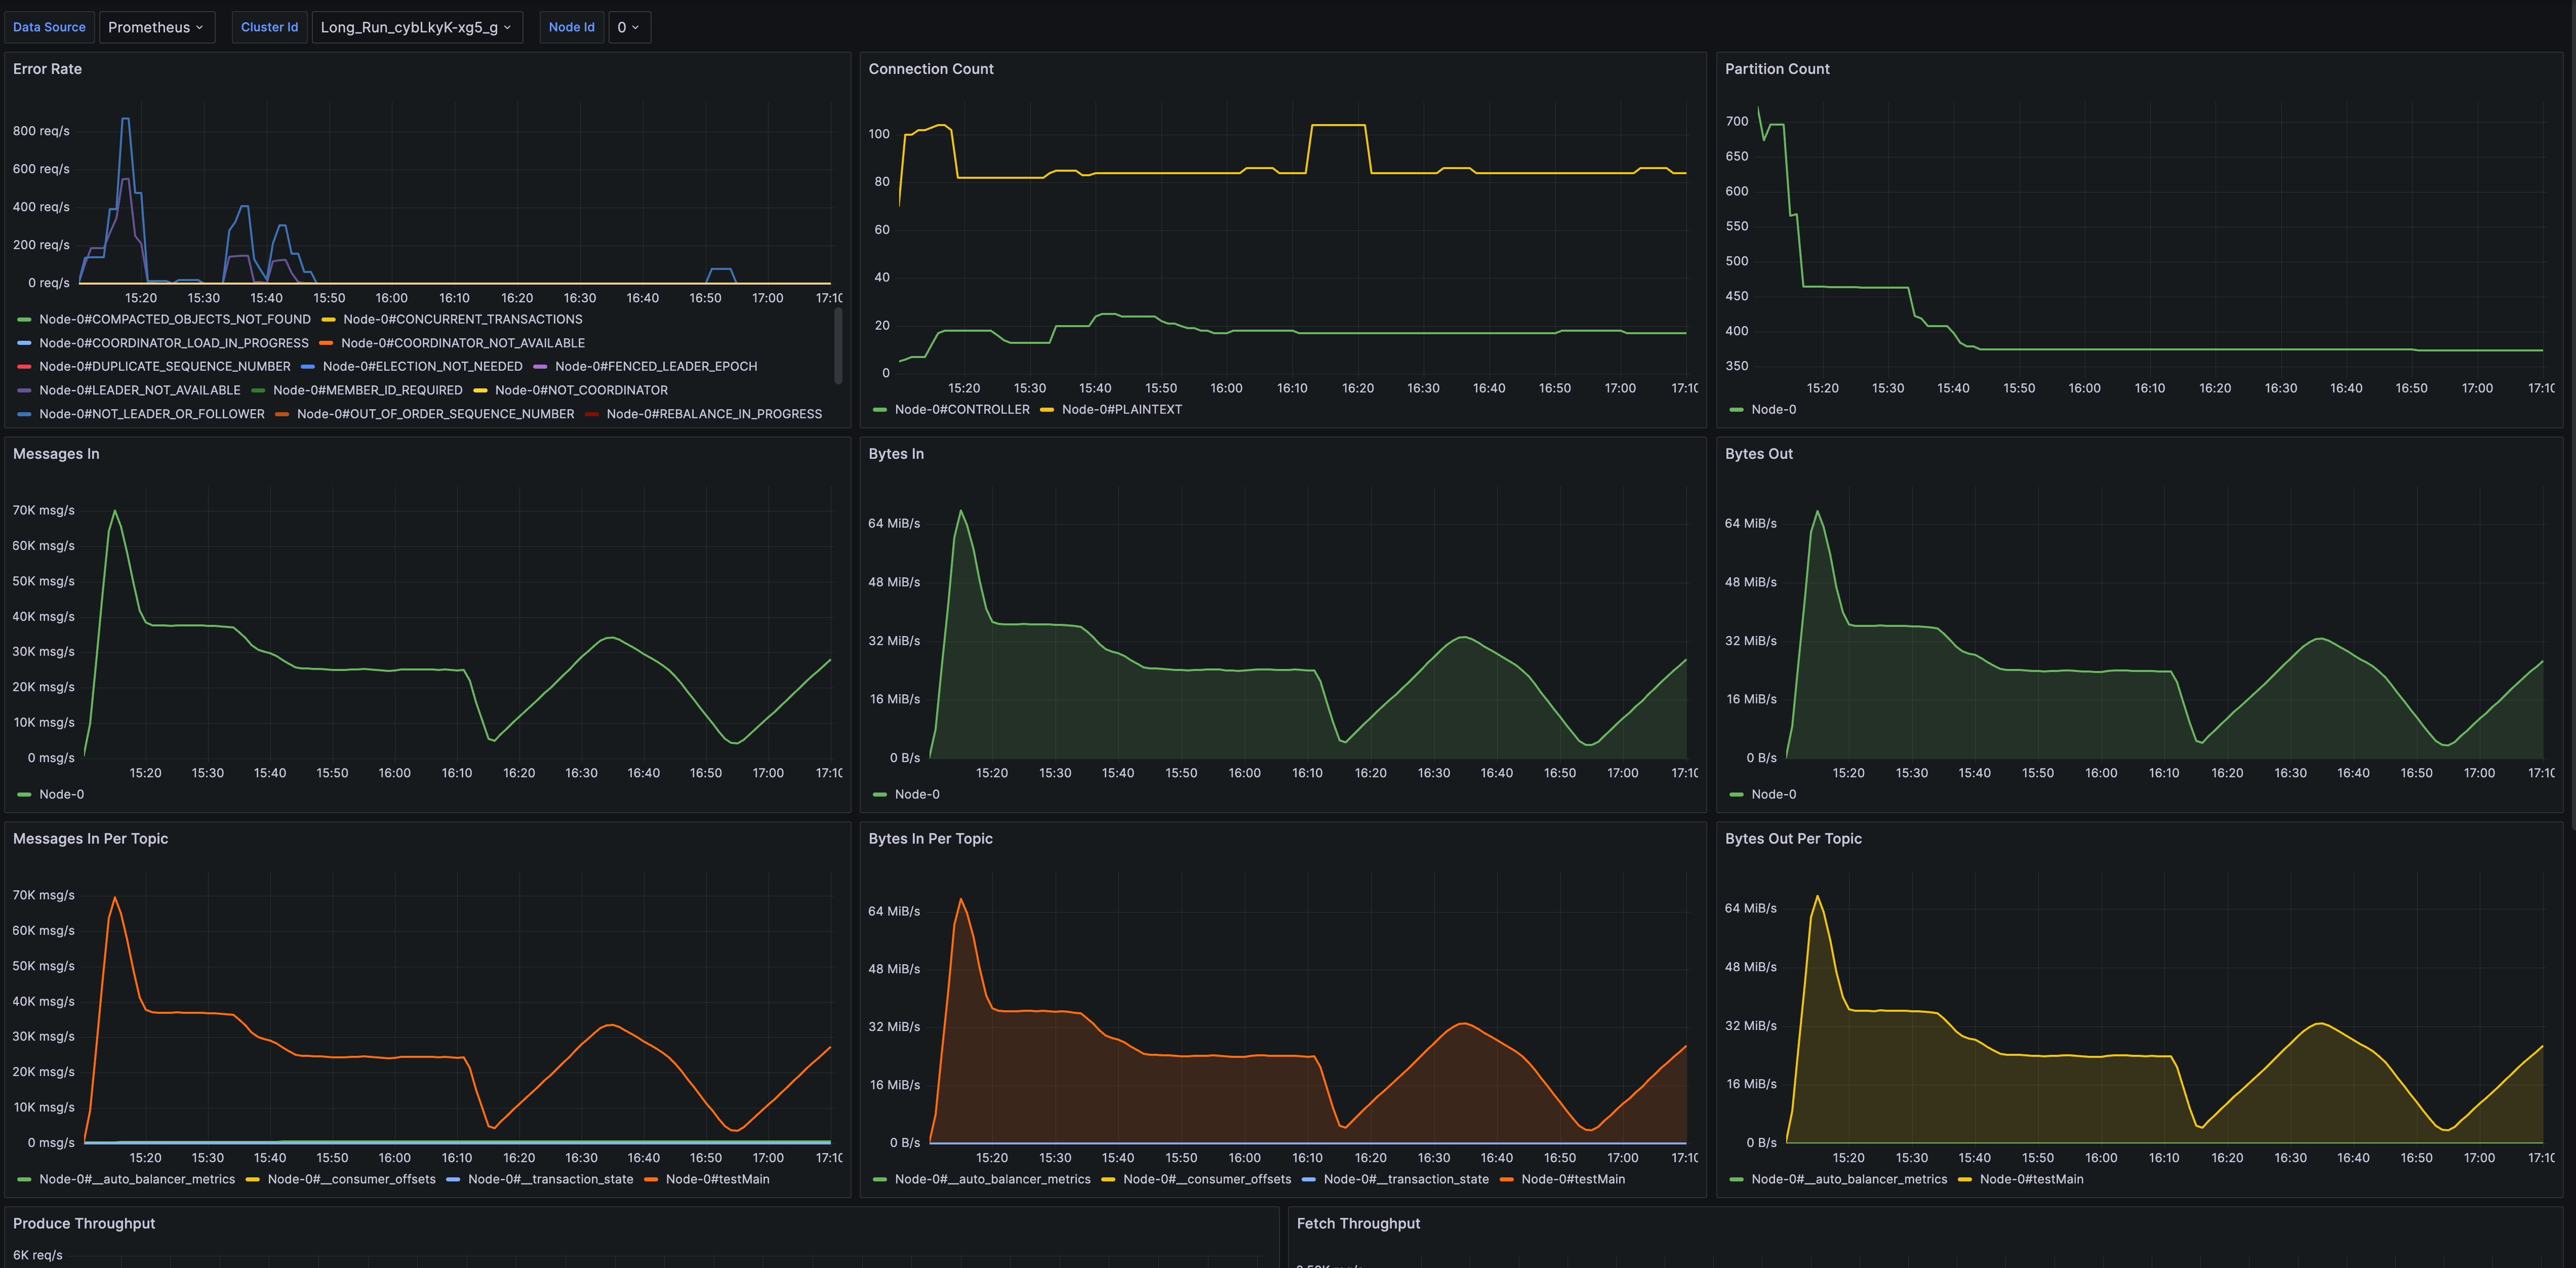
- Broker Metrics: 提供了 Broker 维度的监控,包括连接数量、分区数量、节点流量、节点请求等
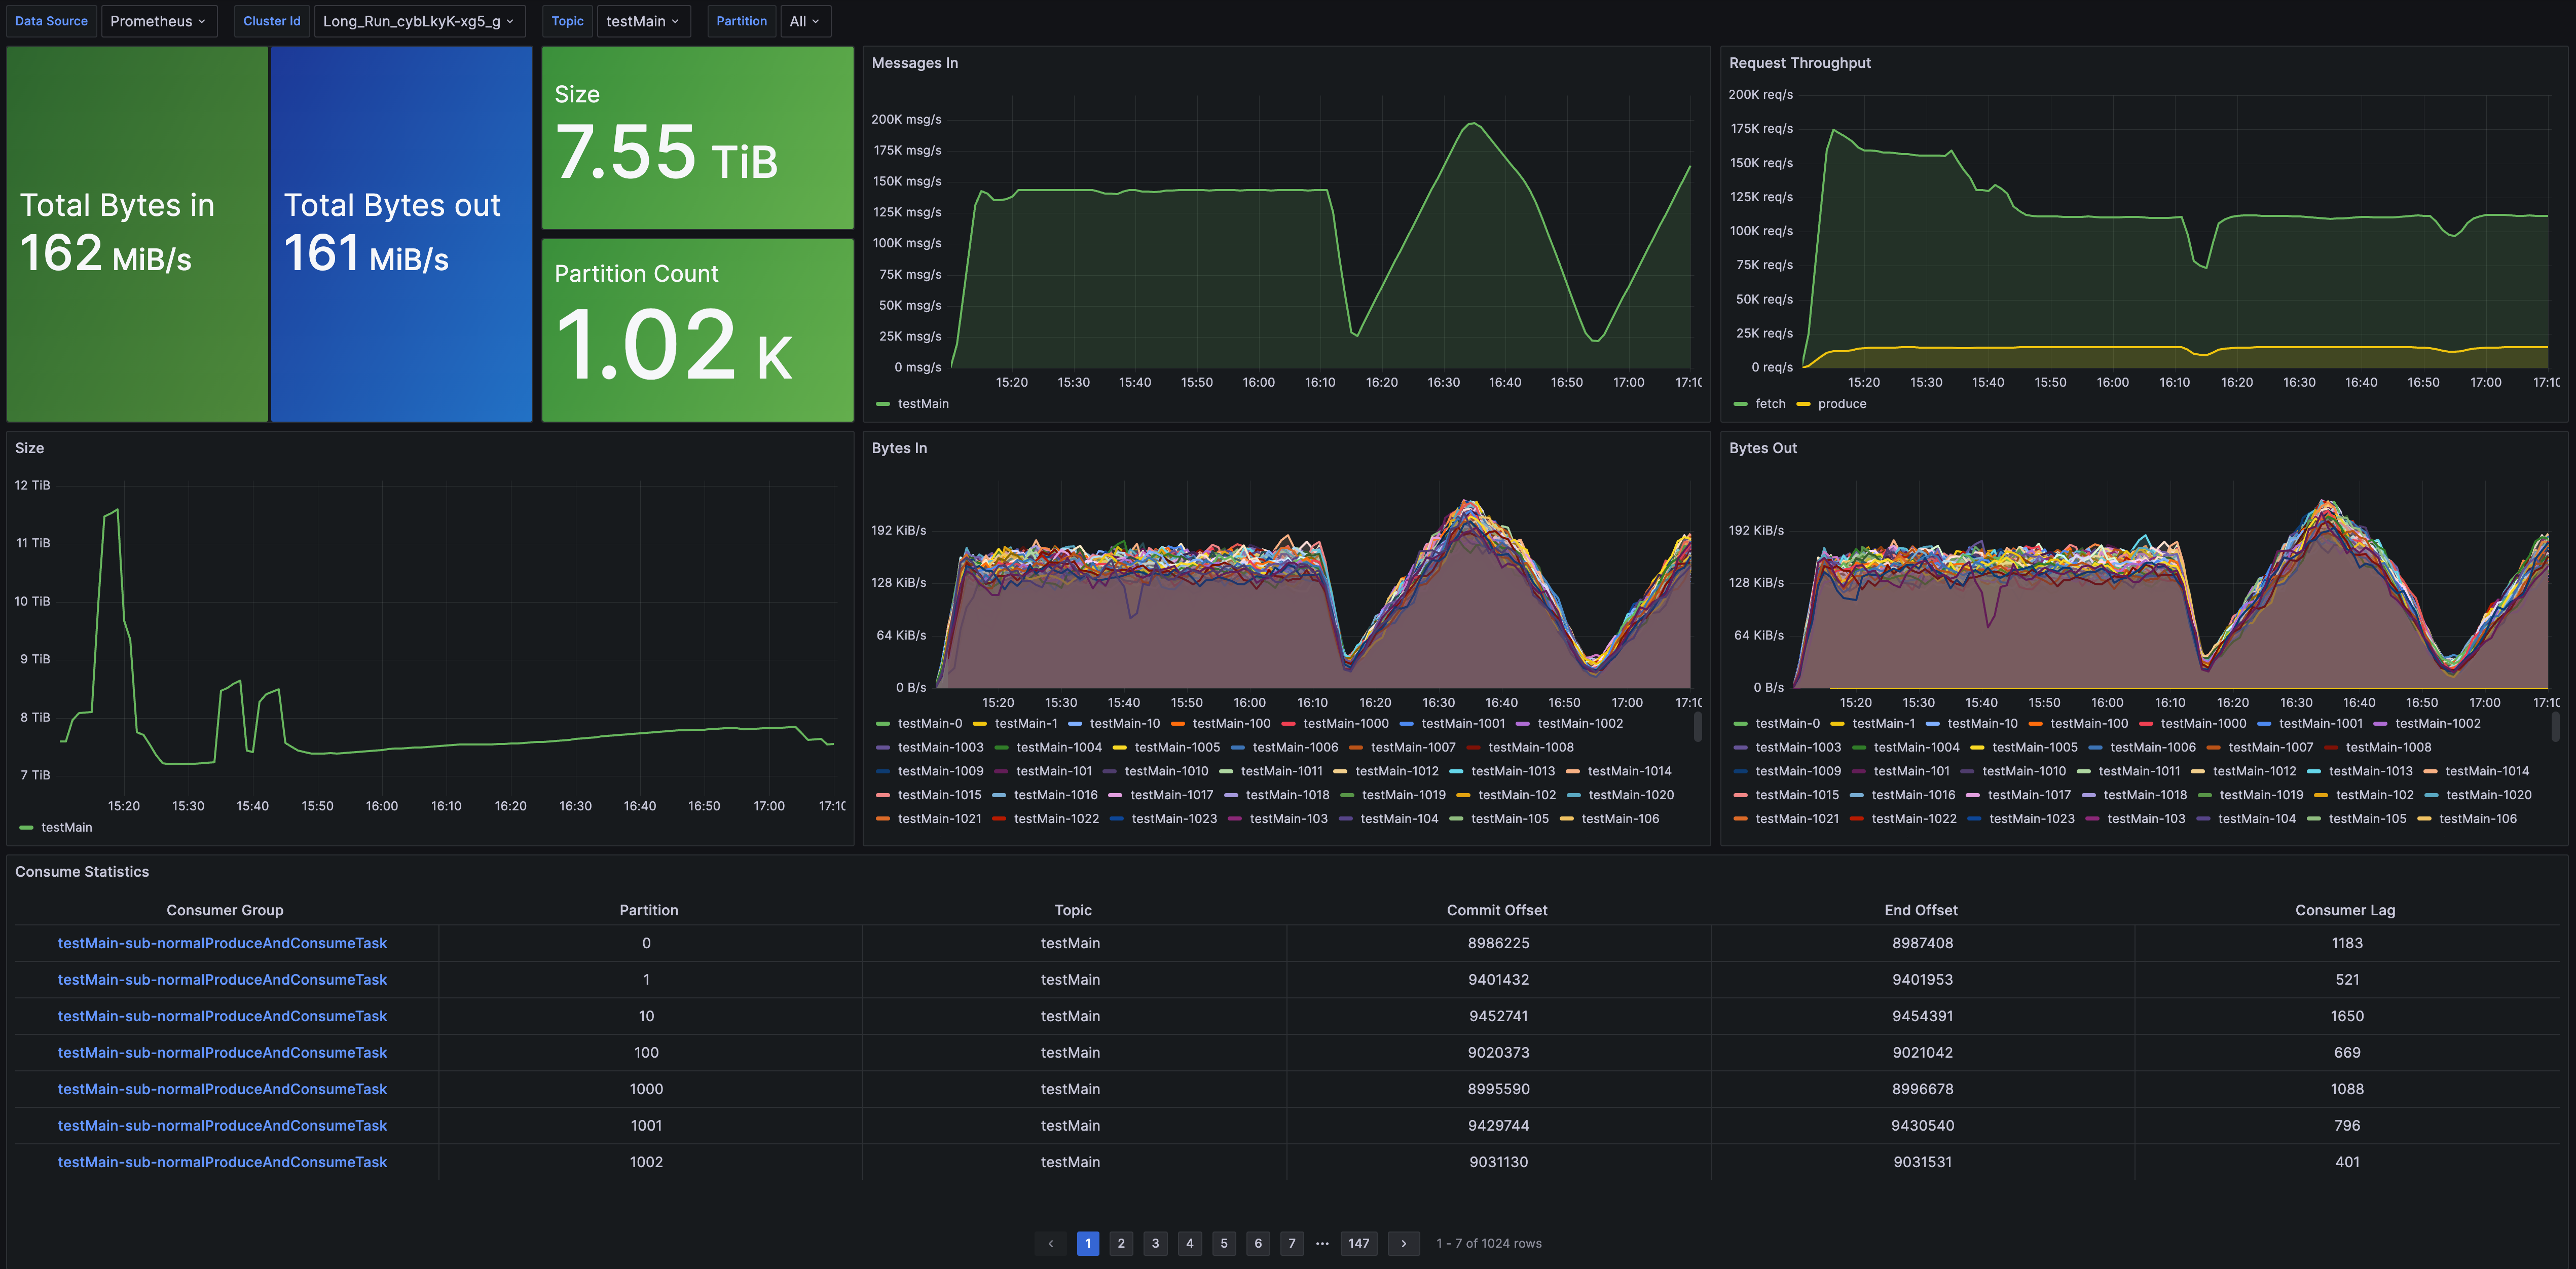
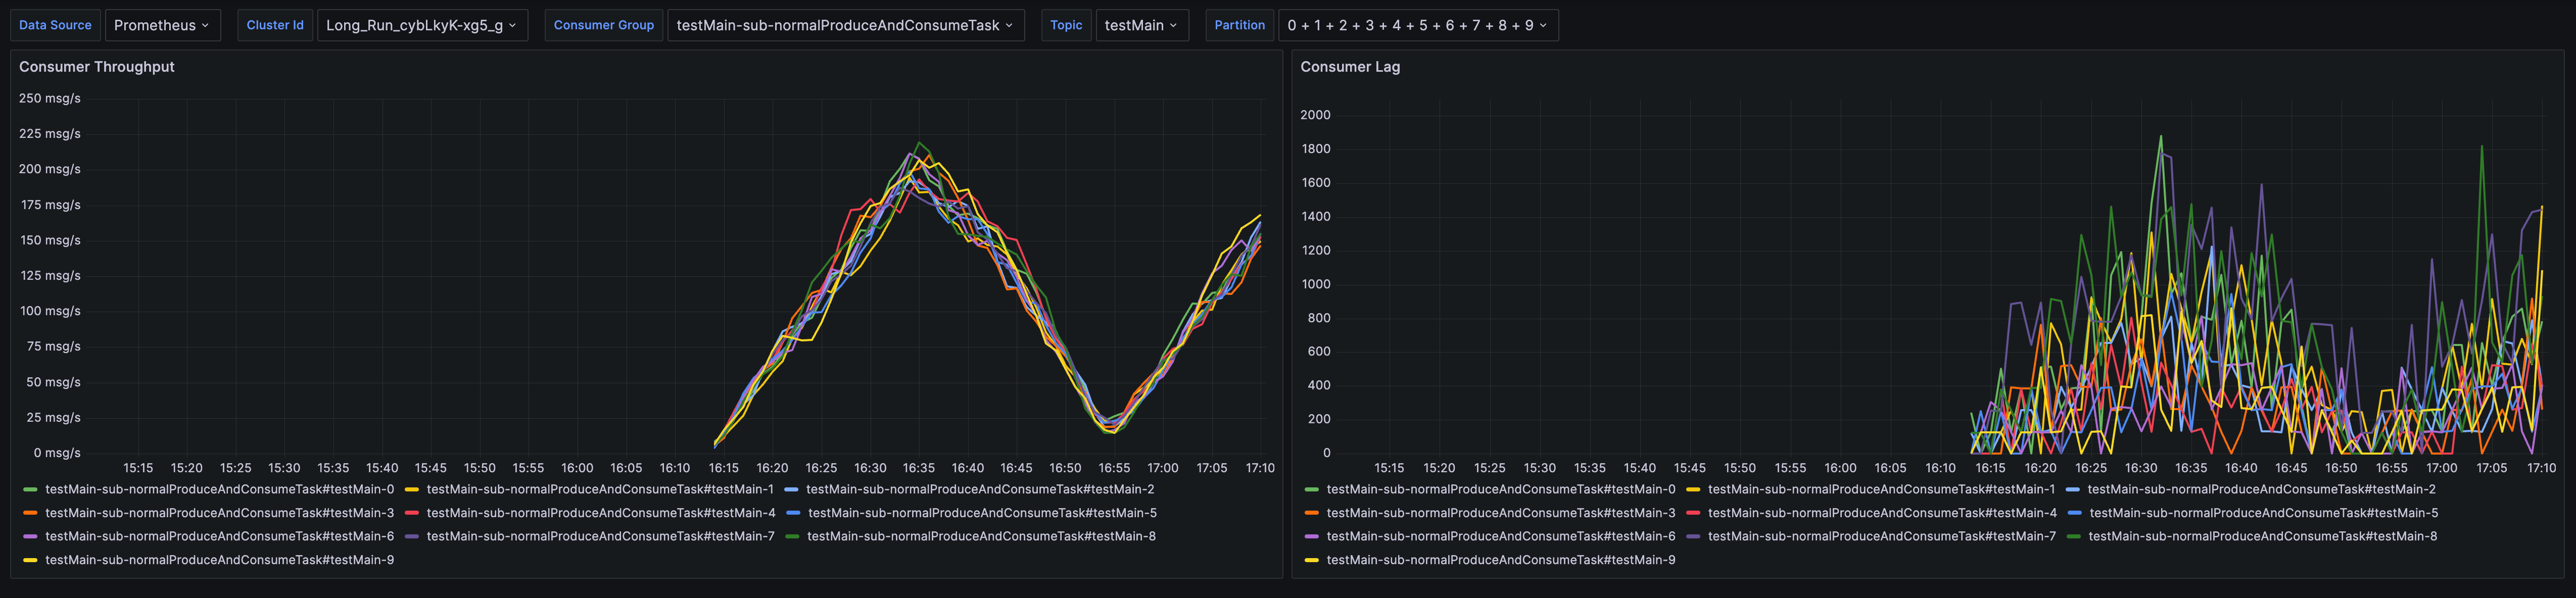
- Topic Metrics: 提供了 Topic 维度的指标监控,包括消息吞吐、数据总量、分区数量、消费延迟等
- Group Metrics: 提供了 Group 维度的指标监控,包括消费速率和消费延迟
业务监控报警
AutoMQ 基于 Prometheus 集成,将 Metrics 数据推送到 Prometheus 后,用户可以使用 Prometheus 配置自定义报警规则,用于监控业务压力水位等异常情况。
报警模板
AutoMQ 基于生产环境高频使用的 Metrics 沉淀了一系列报警模板,用户可根据实际需求选择配置其中的报警规则。
报警规则模板列表如下:
| 报警规则项 | 作用和场景 |
|---|---|
| HighTopicBytesInPerSec |
|
| HighTopicBytesInPerSecDayToDayChange |
|
| LowTopicBytesInPerSec |
|
| LowTopicBytesInPerSecDayToDayChange |
|
| HighTopicBytesOutPerSec |
|
| HighTopicBytesOutPerSecDayToDayChange |
|
| LowTopicBytesOutPerSec |
|
| LowTopicBytesOutPerSecDayToDayChange |
|
| HighGroupConsumeRatePerTopic |
|
| LowGroupConsumeRatePerTopic |
|
| HighGroupConsumerLag |
|
完整的报警模板 yaml 文件参考下方,可以用于复制导入。
# This is the alert rules template for AutoMQ, please modify the alert thresholds and period per your needs
# before applying it to your production environment.
groups:
  - name: kafka_alerts
    rules:
      - alert: HighTopicBytesInPerSec
        expr: sum(max(rate(kafka_network_io_bytes_total{direction="in", topic="example_topic"}[1m])) by (job, topic, partition)) by (job, topic) > 50 * 1024 * 1024
        for: 5m
        labels:
          severity: warning
        annotations:
          summary: "High inbound network throughput {{ printf \"%0.2f\" $value }} Bytes/s for topic {{ $labels.topic }} in cluster {{ $labels.job }}"
          description: "The inbound bytes per second produced by topic {{ $labels.topic }} in cluster {{ $labels.job }} is exceeding threshold."

      - alert: LowTopicBytesInPerSec
        expr: sum(max(rate(kafka_network_io_bytes_total{direction="in", topic="example_topic"}[1m])) by (job, topic, partition)) by (job, topic) < 1024
        for: 5m
        labels:
          severity: warning
        annotations:
          summary: "Low inbound network throughput {{ printf \"%0.2f\" $value }} Bytes/s for topic {{ $labels.topic }} in cluster {{ $labels.job }}"
          description: "The inbound bytes per second produced by topic {{ $labels.topic }} in cluster {{ $labels.job }} is below threshold."

      - alert: HighTopicBytesOutPerSec
        expr: sum(max(rate(kafka_network_io_bytes_total{direction="out", topic="example_topic"}[1m])) by (job, topic, partition)) by (job, topic) > 50 * 1024 * 1024
        for: 5m
        labels:
          severity: warning
        annotations:
          summary: "High outbound network throughput {{ printf \"%0.2f\" $value }} Bytes/s for topic {{ $labels.topic }} in cluster {{ $labels.job }}"
          description: "The outbound bytes per second produced by topic {{ $labels.topic }} in cluster {{ $labels.job }} is exceeding threshold."

      - alert: LowTopicBytesOutPerSec
        expr: sum(max(rate(kafka_network_io_bytes_total{direction="out", topic="example_topic"}[1m])) by (job, topic, partition)) by (job, topic) < 1024
        for: 5m
        labels:
          severity: warning
        annotations:
          summary: "Low outbound network throughput {{ printf \"%0.2f\" $value }} Bytes/s for topic {{ $labels.topic }} in cluster {{ $labels.job }}"
          description: "The outbound bytes per second produced by topic {{ $labels.topic }} in cluster {{ $labels.job }} is below threshold."

      - alert: HighGroupConsumeRatePerTopic
        expr: sum(max(rate(kafka_group_commit_offset{consumer_group="example_group", topic="example_topic"}[1m])) by (job, consumer_group, topic, partition)) by (job, consumer_group, topic) > 1000
        for: 5m
        labels:
          severity: warning
        annotations:
          summary: "High group consume rate {{ printf \"%0.2f\" $value }} msg/s for consumer group {{ $labels.consumer_group }} on topic {{ $labels.topic }} in cluster {{ $labels.job }}"
          description: "The consume rate of consumer group {{ $labels.consumer_group }} on topic {{ $labels.topic }} in cluster {{ $labels.job }} is exceeding threshold."

      - alert: LowGroupConsumeRatePerTopic
        expr: sum(max(rate(kafka_group_commit_offset{consumer_group="example_group", topic="example_topic"}[1m])) by (job, consumer_group, topic, partition)) by (job, consumer_group, topic) < 10
        for: 5m
        labels:
          severity: warning
        annotations:
          summary: "Low group consume rate {{ printf \"%0.2f\" $value }} msg/s for consumer group {{ $labels.consumer_group }} on topic {{ $labels.topic }} in cluster {{ $labels.job }}"
          description: "The consume rate of consumer group {{ $labels.consumer_group }} on topic {{ $labels.topic }} in cluster {{ $labels.job }} is below threshold."

      - alert: HighTopicBytesInPerSecDayToDayChange
        expr: (sum(max(rate(kafka_network_io_bytes_total{direction="in", topic="example_topic"}[1m])) by (job, topic, partition)) by (job, topic)
          - sum(max(rate(kafka_network_io_bytes_total{direction="in", topic="example_topic"}[1m] offset 24h)) by (job, topic, partition)) by (job, topic))
          / sum(max(rate(kafka_network_io_bytes_total{direction="in", topic="example_topic"}[1m] offset 24h)) by (job, topic, partition)) by (job, topic) > 0.2
        for: 5m
        labels:
          severity: warning
        annotations:
          summary: "High inbound network throughput change {{ printf \"%0.2f\" $value }} for topic {{ $labels.topic }} in cluster {{ $labels.job }}"
          description: "The increase of inbound bytes per second produced by topic {{ $labels.topic }} in cluster {{ $labels.job }} compared to 24h ago is exceeding threshold"

      - alert: LowTopicBytesInPerSecDayToDayChange
        expr: (sum(max(rate(kafka_network_io_bytes_total{direction="in", topic="example_topic"}[1m])) by (job, topic, partition)) by (job, topic)
          - sum(max(rate(kafka_network_io_bytes_total{direction="in", topic="example_topic"}[1m] offset 24h)) by (job, topic, partition)) by (job, topic))
          / sum(max(rate(kafka_network_io_bytes_total{direction="in", topic="example_topic"}[1m] offset 24h)) by (job, topic, partition)) by (job, topic) < -0.2
        for: 5m
        labels:
          severity: warning
        annotations:
          summary: "Low inbound network throughput change {{ printf \"%0.2f\" $value }} for topic {{ $labels.topic }} in cluster {{ $labels.job }}"
          description: "The decrease of inbound bytes per second produced by topic {{ $labels.topic }} in cluster {{ $labels.job }} compared to 24h ago is exceeding threshold"

      - alert: HighTopicBytesOutPerSecDayToDayChange
        expr: (sum(max(rate(kafka_network_io_bytes_total{direction="out", topic="example_topic"}[1m])) by (job, topic, partition)) by (job, topic)
          - sum(max(rate(kafka_network_io_bytes_total{direction="out", topic="example_topic"}[1m] offset 24h)) by (job, topic, partition)) by (job, topic))
          / sum(max(rate(kafka_network_io_bytes_total{direction="out", topic="example_topic"}[1m] offset 24h)) by (job, topic, partition)) by (job, topic) > 0.2
        for: 5m
        labels:
          severity: warning
        annotations:
          summary: "High outbound network throughput change {{ printf \"%0.2f\" $value }} for topic {{ $labels.topic }} in cluster {{ $labels.job }}"
          description: "The increase of outbound bytes per second produced by topic {{ $labels.topic }} in cluster {{ $labels.job }} compared to 24h ago is exceeding threshold"

      - alert: LowTopicBytesOutPerSecDayToDayChange
        expr: (sum(max(rate(kafka_network_io_bytes_total{direction="out", topic="example_topic"}[1m])) by (job, topic, partition)) by (job, topic)
          - sum(max(rate(kafka_network_io_bytes_total{direction="out", topic="example_topic"}[1m] offset 24h)) by (job, topic, partition)) by (job, topic))
          / sum(max(rate(kafka_network_io_bytes_total{direction="out", topic="example_topic"}[1m] offset 24h)) by (job, topic, partition)) by (job, topic) < -0.2
        for: 5m
        labels:
          severity: warning
        annotations:
          summary: "Low outbound network throughput change {{ printf \"%0.2f\" $value }} for topic {{ $labels.topic }} in cluster {{ $labels.job }}"
          description: "The decrease of outbound bytes per second produced by topic {{ $labels.topic }} in cluster {{ $labels.job }} compared to 24h ago is exceeding threshold"

      - alert: HighGroupConsumerLag
        expr: sum(max(kafka_log_end_offset{topic="example_topic"}) by (job, topic, partition)) by (job, topic)
          - on (topic) group_left (consumer_group) sum(max(kafka_group_commit_offset{consumer_group="example_group", topic="example_topic"}) by (job, consumer_group, topic, partition)) by (job, consumer_group, topic) > 10000
        for: 1m
        labels:
          severity: warning
        annotations:
          summary: "High group consumer lag {{ printf \"%0.f\" $value }} for consumer group {{ $labels.consumer_group }} in cluster {{ $labels.job }} on topic {{ $labels.topic }}."
          description: "The consumer lag of consumer group {{ $labels.consumer_group }} in cluster {{ $labels.job }} on topic {{ $labels.topic }} is exceeding threshold."
配置步骤
AutoMQ 提供了上述 Prometheus 报警模板,用户可将该报警模板导入当前的 Prometheus 集群(实例)中,然后基于报警模板配置自定义报警规则。
下文以阿里云 Prometheus 为例,演示报警规则配置方法,如果当前是自建 Prometheus,自行参考调整。
在阿里云 Prometheus 配置报警
- 导入报警模板: 打开阿里云 Prometheus 控制台,进入告警规则模板 ,选择批量导入模板 。
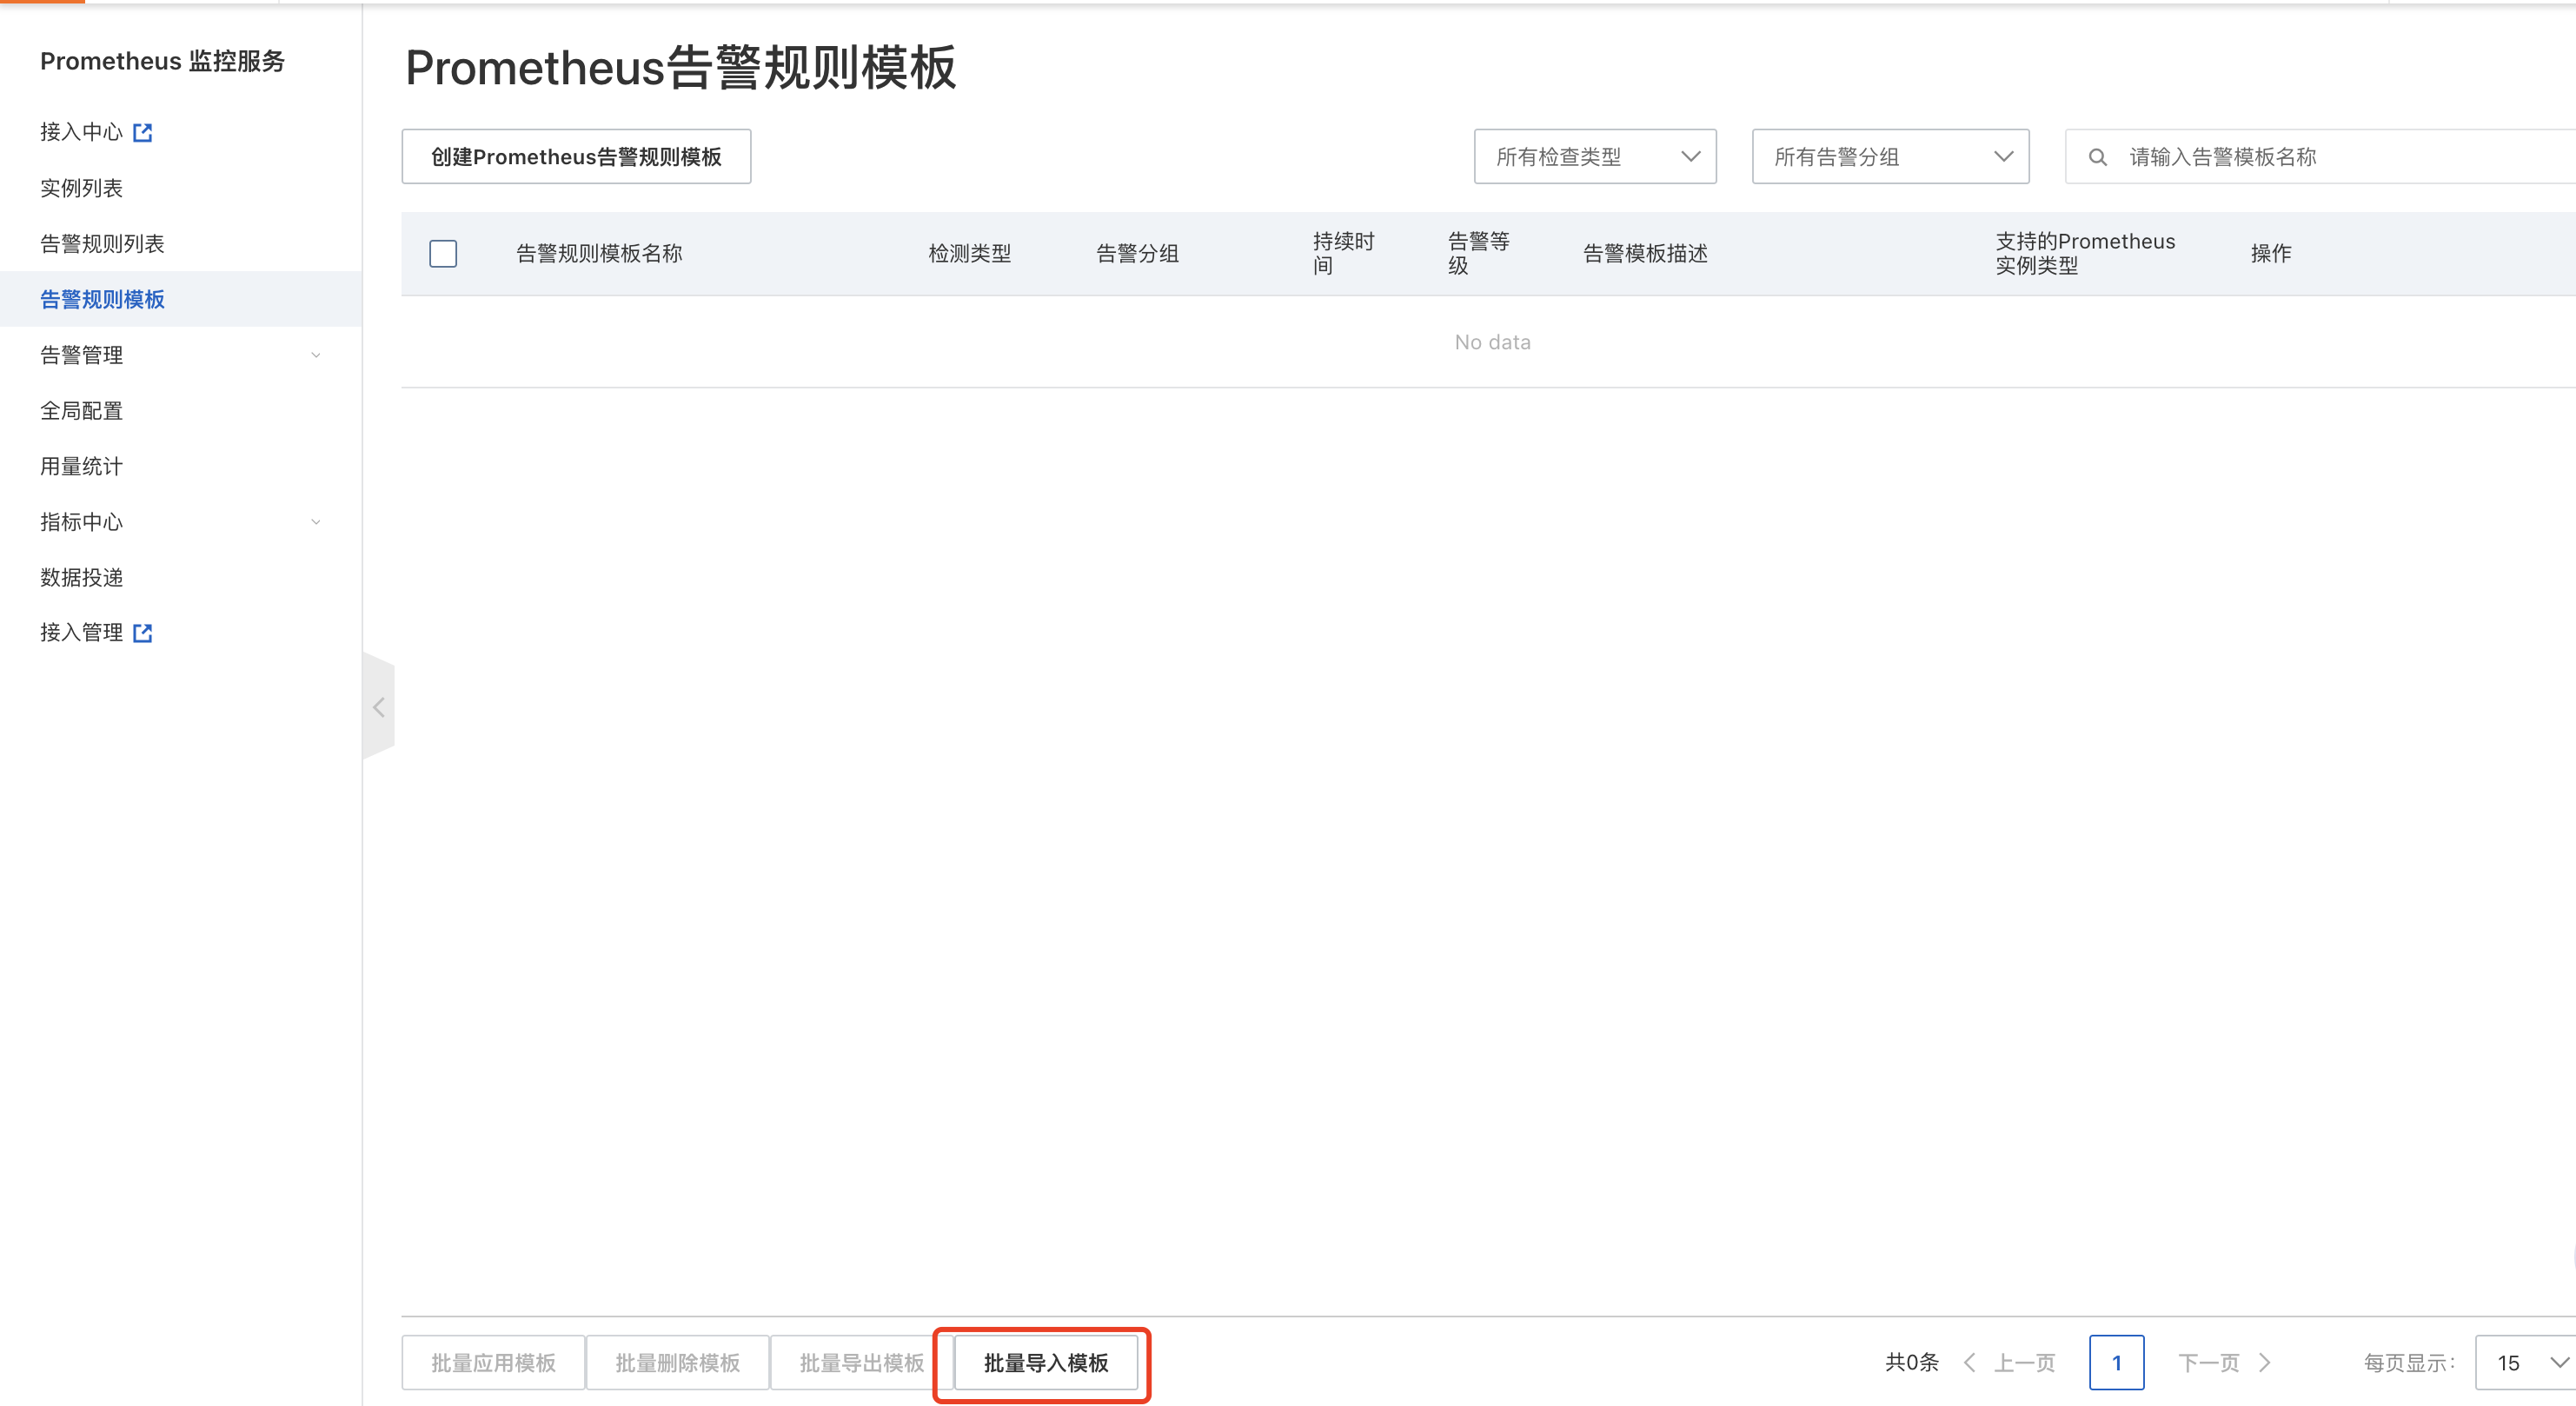
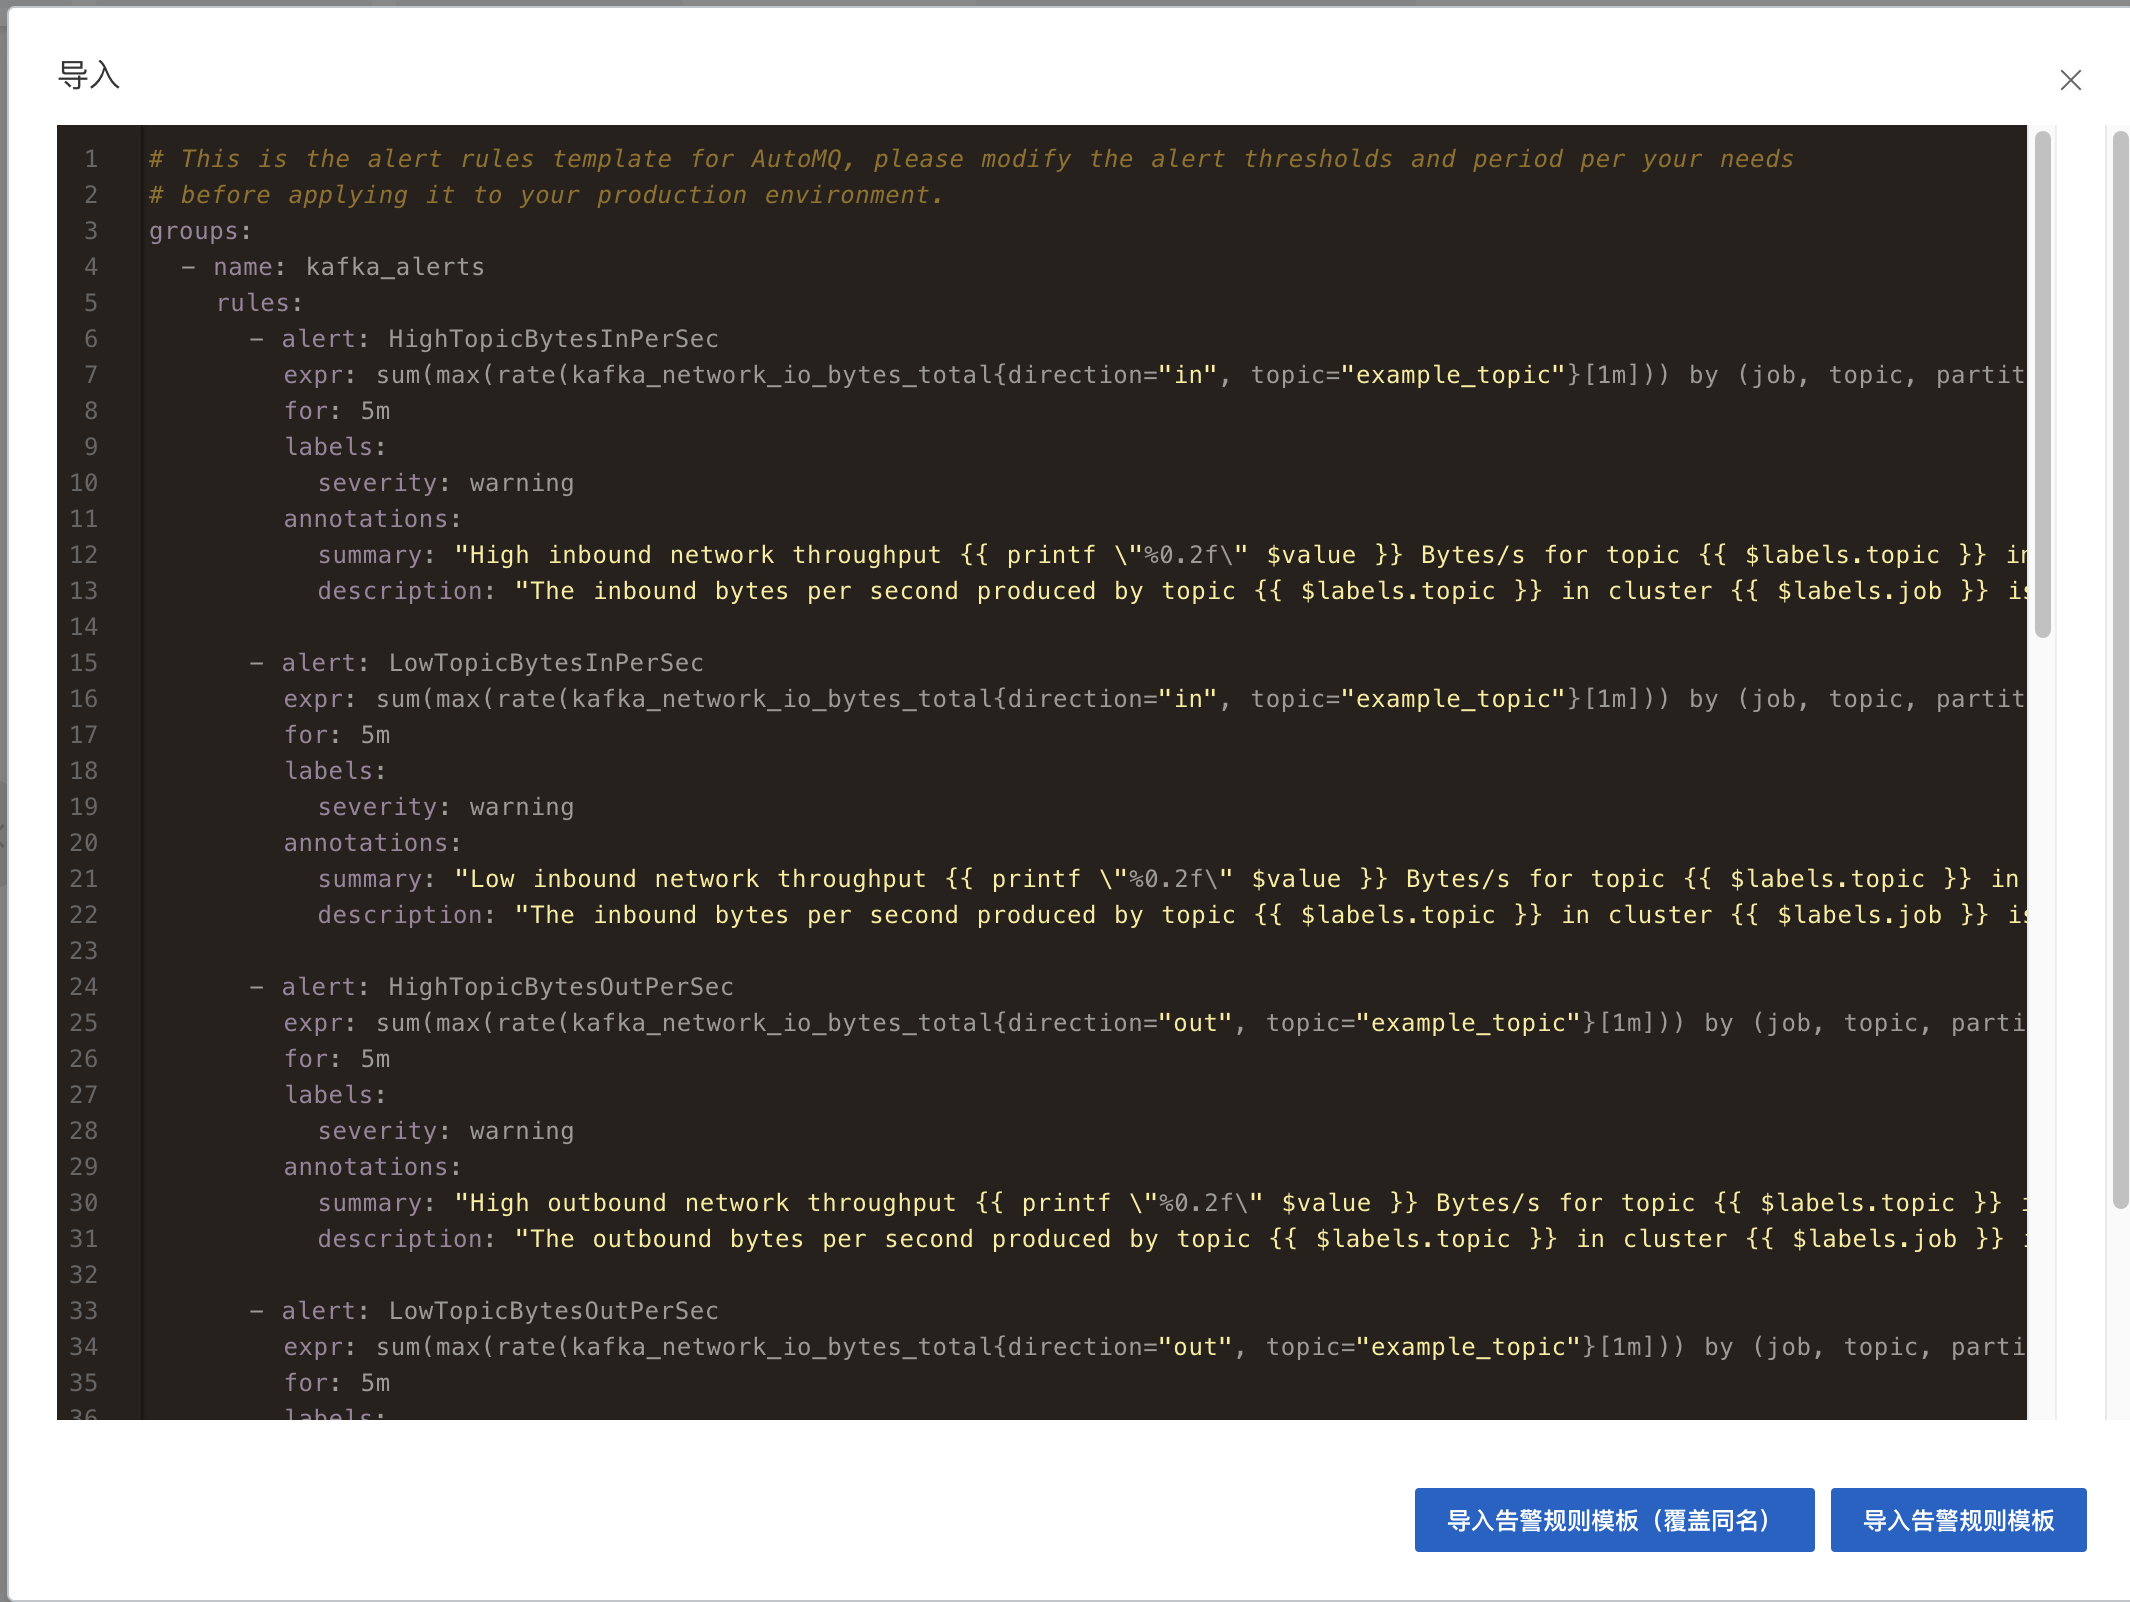
- 复制上述模板文件内容,并导入。
- 应用报警模板: 导入模板完成后,选择特定的报警模板,点击应用模板, 将想要开启的报警模板应用到对应的 Prometheus 实例。
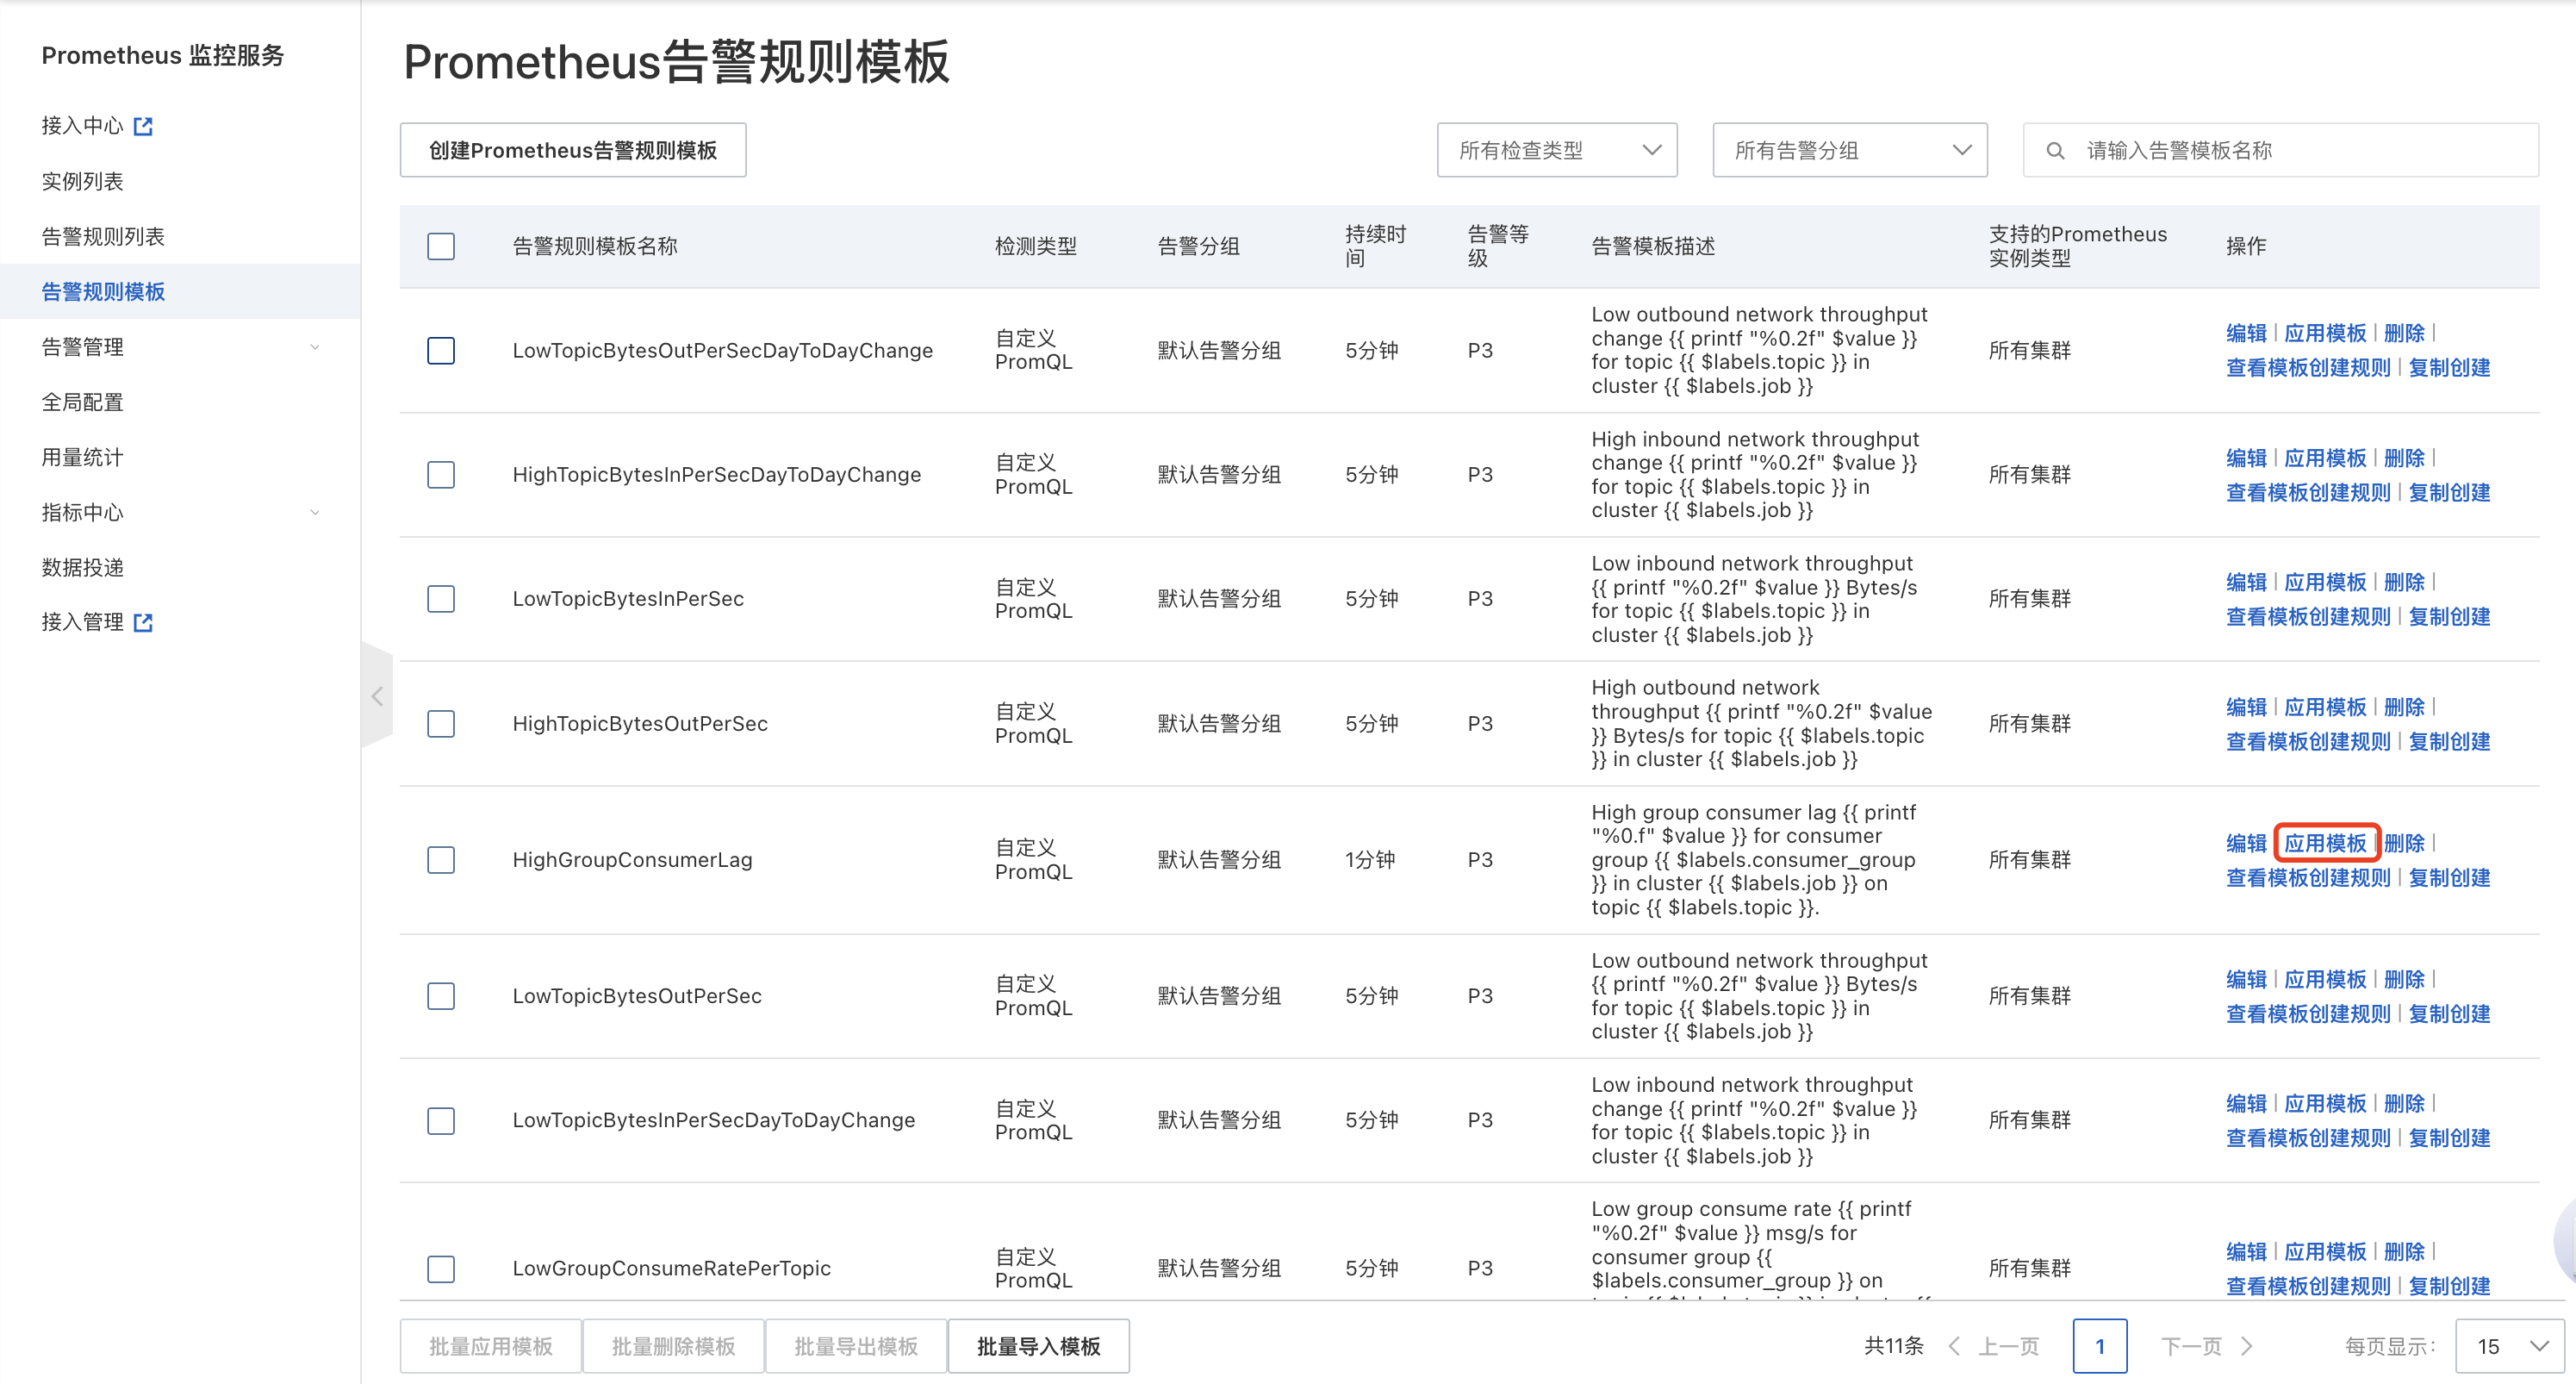
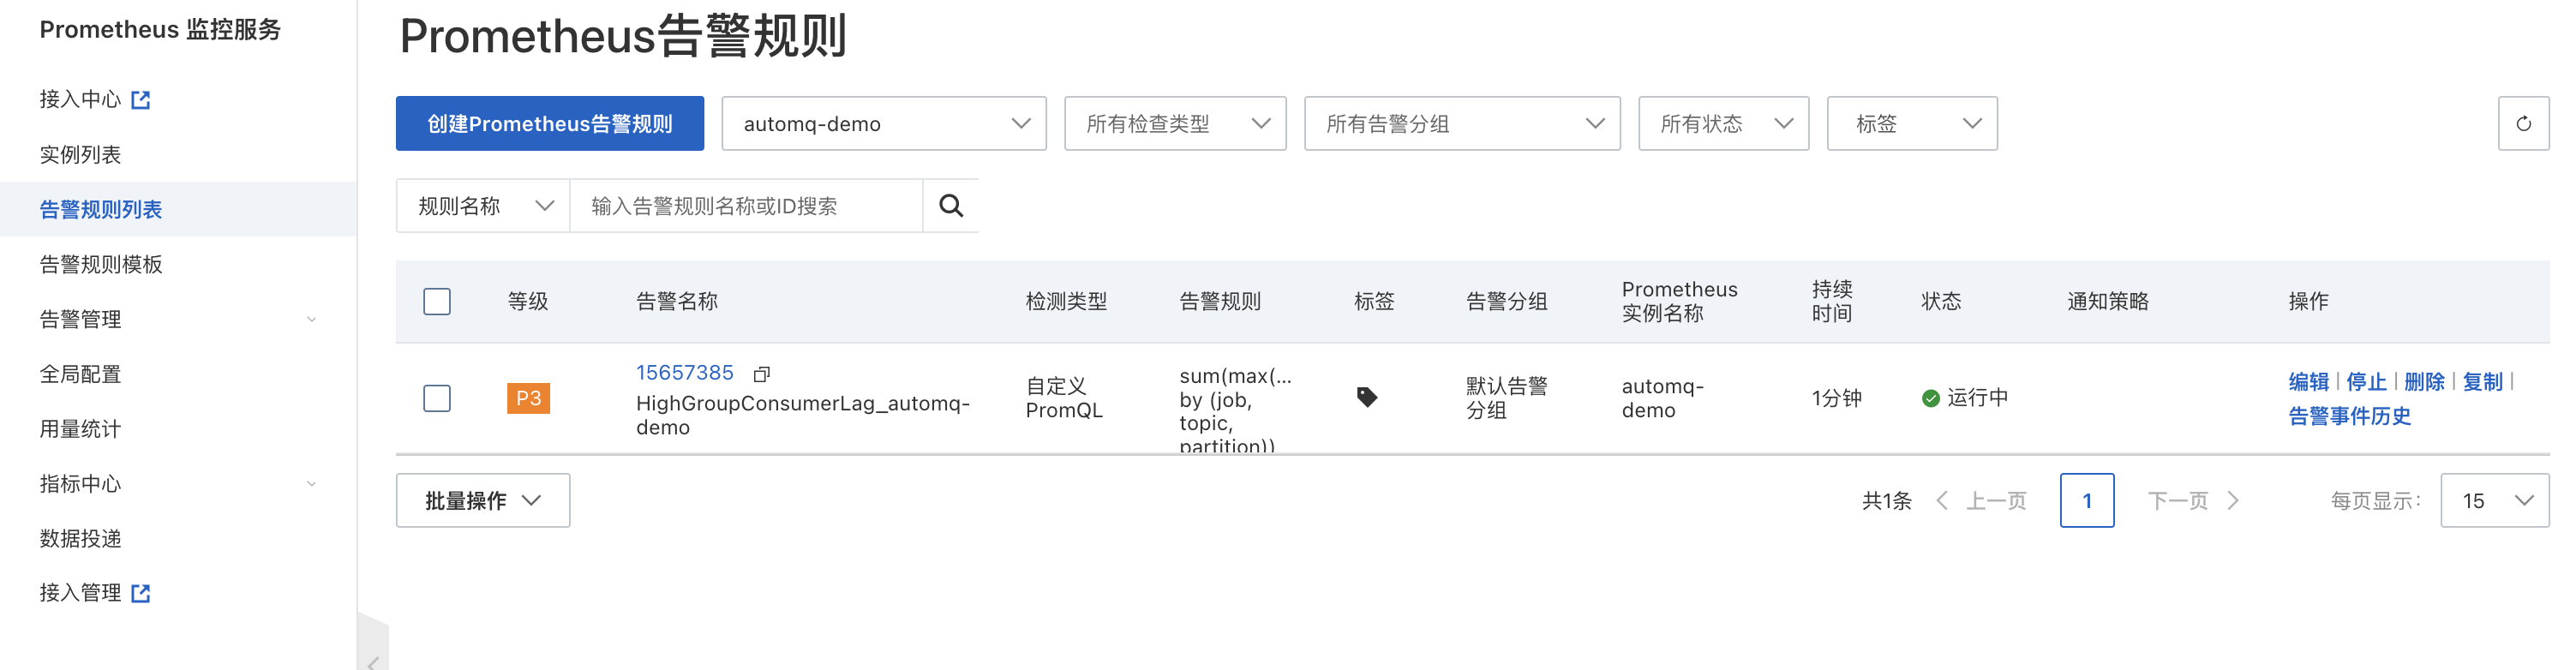
- 配置监控告警规则。 以消费堆积报警 (HighGroupConsumerLag) 为例,点击「应用模板」后,选择对应的 Prometheus 实例,应用成功后,可以在左侧「告警规则列表」中看到已经启用的报警规则。
- 点击「编辑」,进入到报警规则的编辑页面,将 "example_topic" 和 "example_group" 更改为想要监控的 topic 和 consumer group,并将报警阈值(下图中的 10000)修改为期望的值。
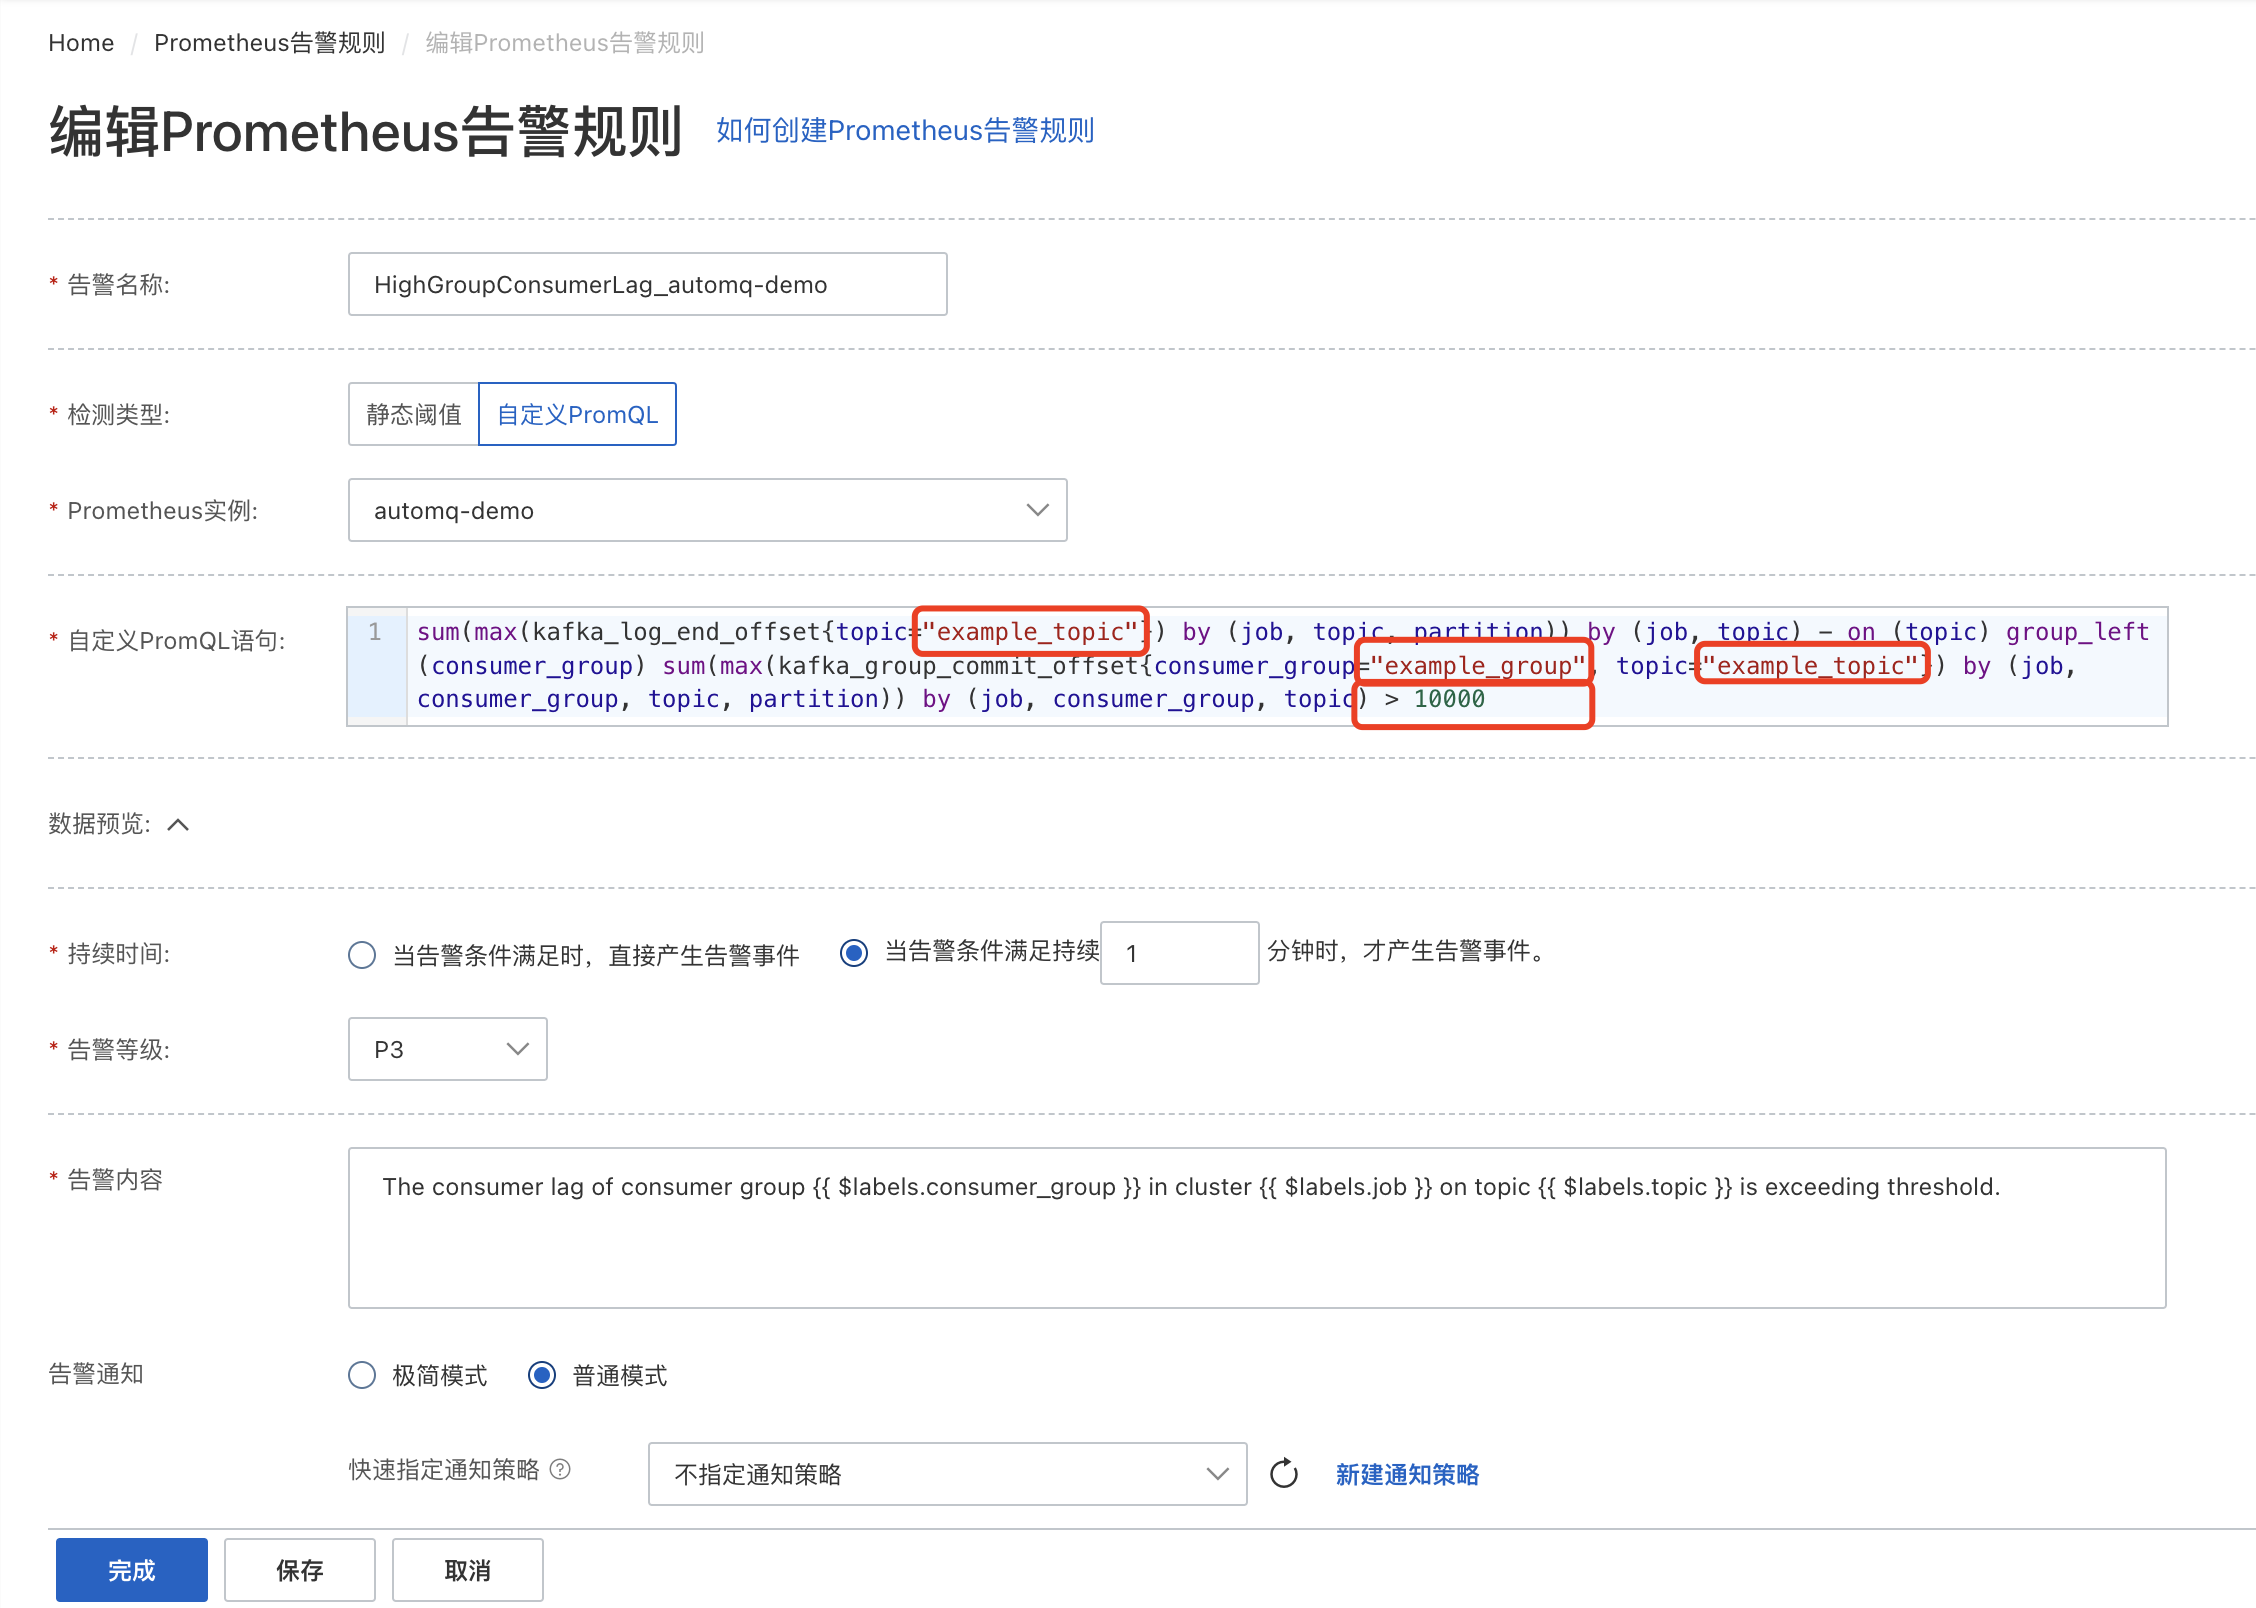
配置通知策略。 编辑完成后,选择已有的通知策略,或点击「新建通知策略」进行创建。
快速复制报警策略(可选)。 如果想要对多个 Topic 或 Consumer Group 进行监控,可点击「复制」 创建多条报警规则。