Monitoring & Alert Via Prometheus
Metrics are crucial analytical data for system observability. AutoMQ supports exposing various native Apache Kafka® Metrics data through Prometheus. This article outlines the details of the Metrics exposed by AutoMQ.
Principles of Metrics Collection and Application
AutoMQ's internal components support the collection of various Kafka Server Metrics data. However, the current Business Edition does not provide built-in Metrics dashboards and monitoring alerts. Users can leverage AutoMQ's integration features to implement custom Metrics monitoring and analysis. The overall architecture is illustrated in the figure below:
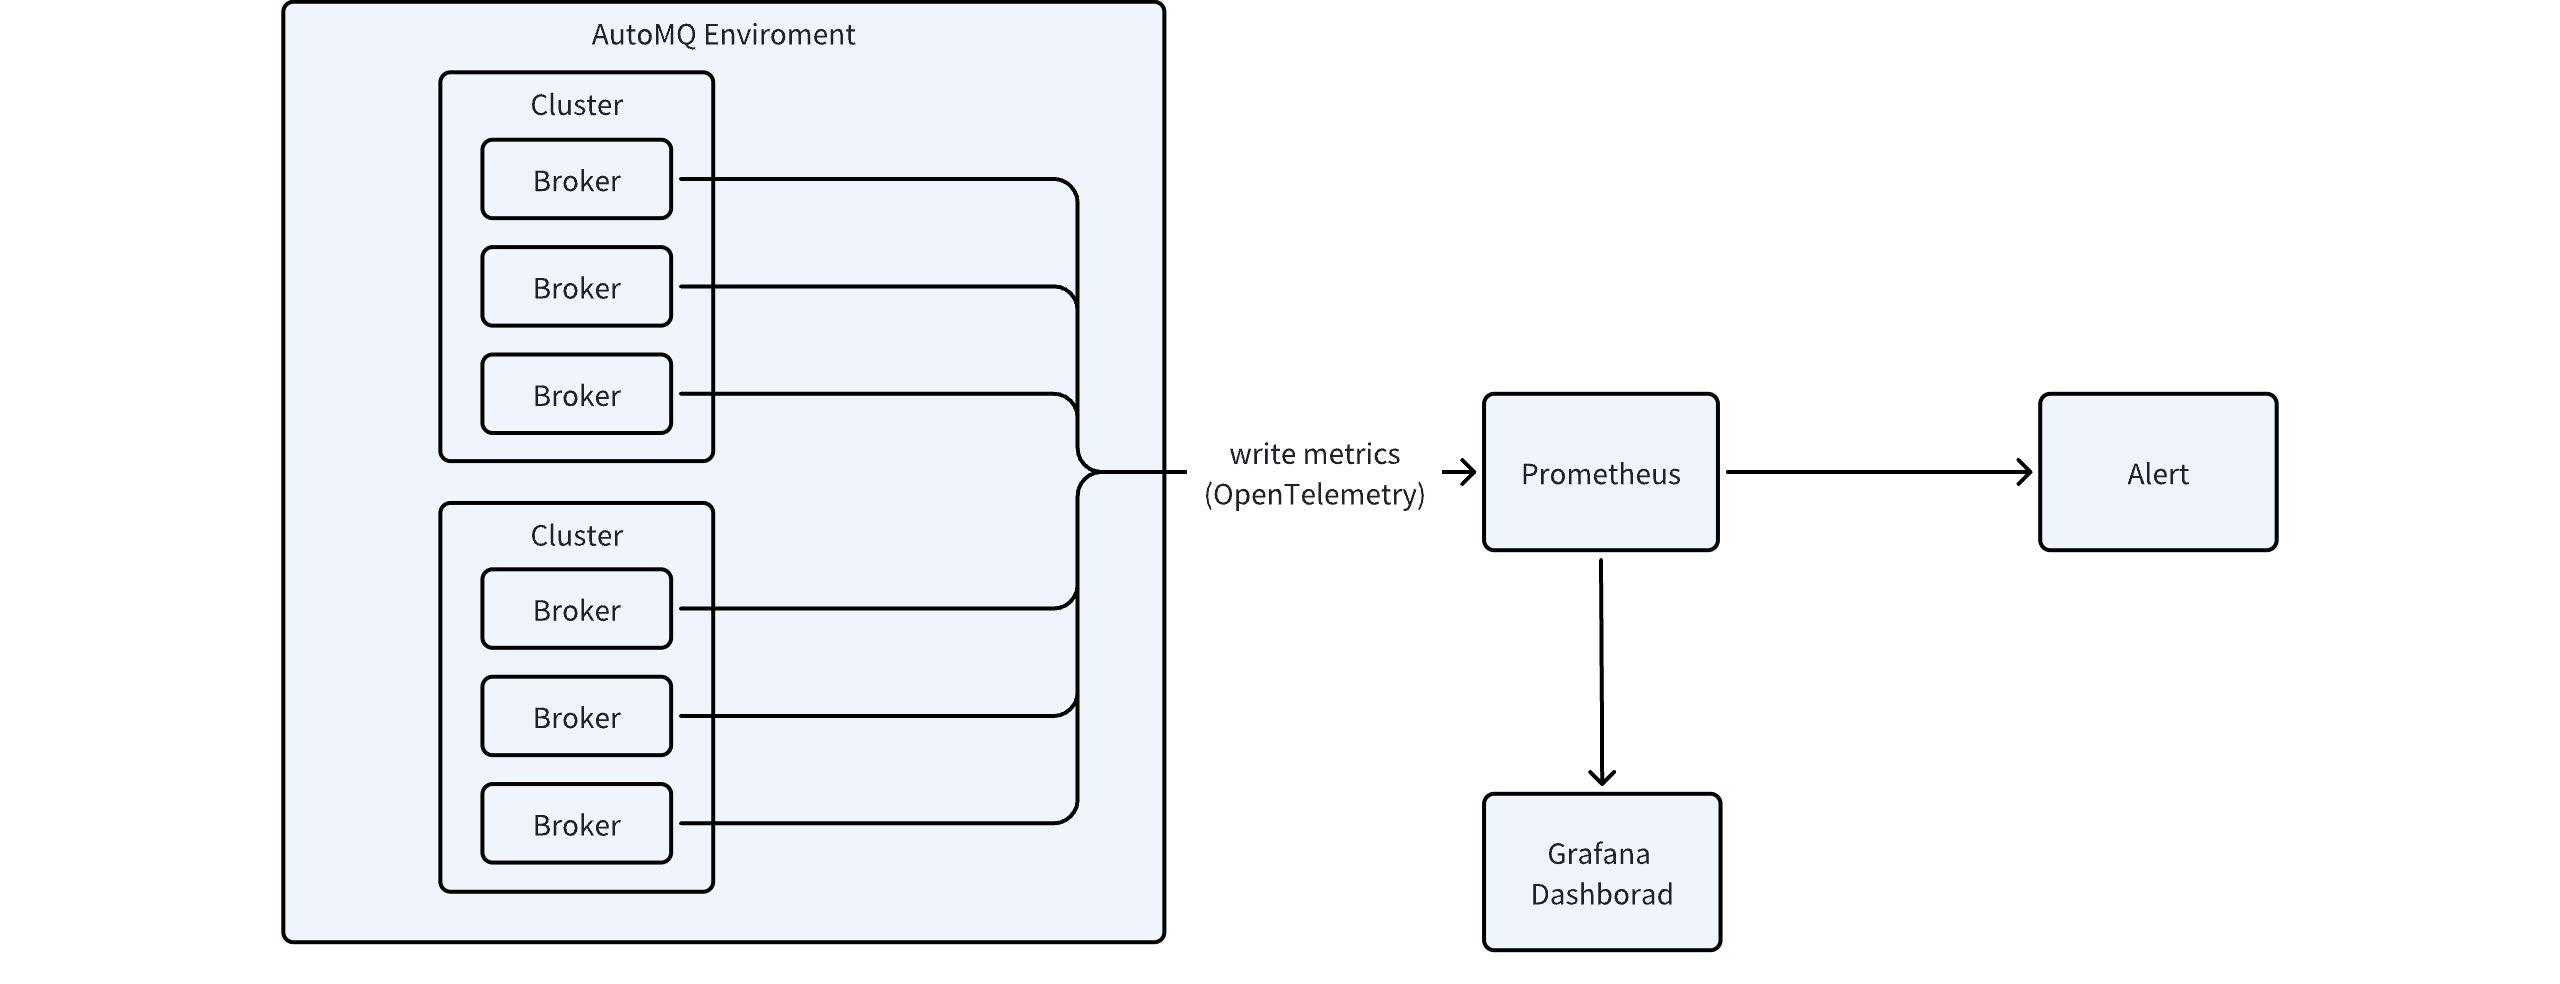
Referencing the above diagram, the steps for applying Metrics collection and analysis are as follows:
Use the Metrics integration feature Manage Integrations▸ to forward Metrics data to a custom Prometheus service.
Use the Grafana templates provided by AutoMQ to quickly configure dashboards in the user's Grafana cluster.
Use the Prometheus alert templates provided by AutoMQ to quickly configure monitoring alerts. For related alert templates, refer to this link.
Prometheus Metrics Definitions
For detailed definitions of the relevant Metrics exposed in the above integration, please refer to the monitoring indicators.
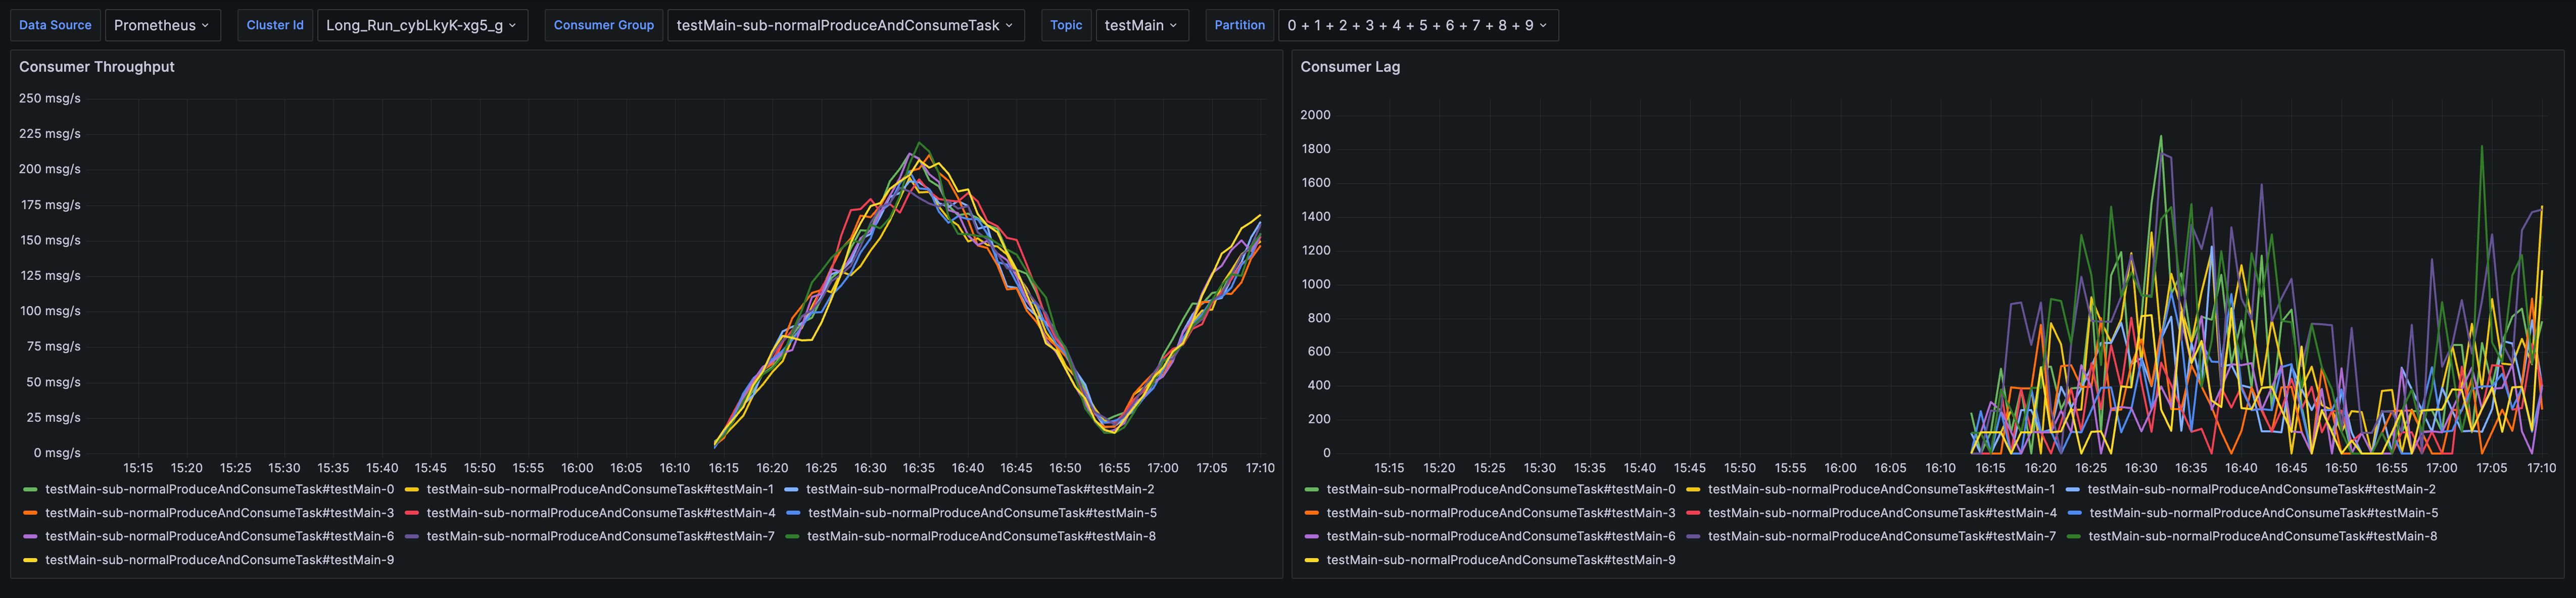
Grafana Dashboard Example
As mentioned above, AutoMQ Cloud does not currently offer managed Grafana dashboard services. Users can refer to the Grafana templates provided by AutoMQ to quickly configure dashboards. The related dashboard templates can be downloaded from this link.
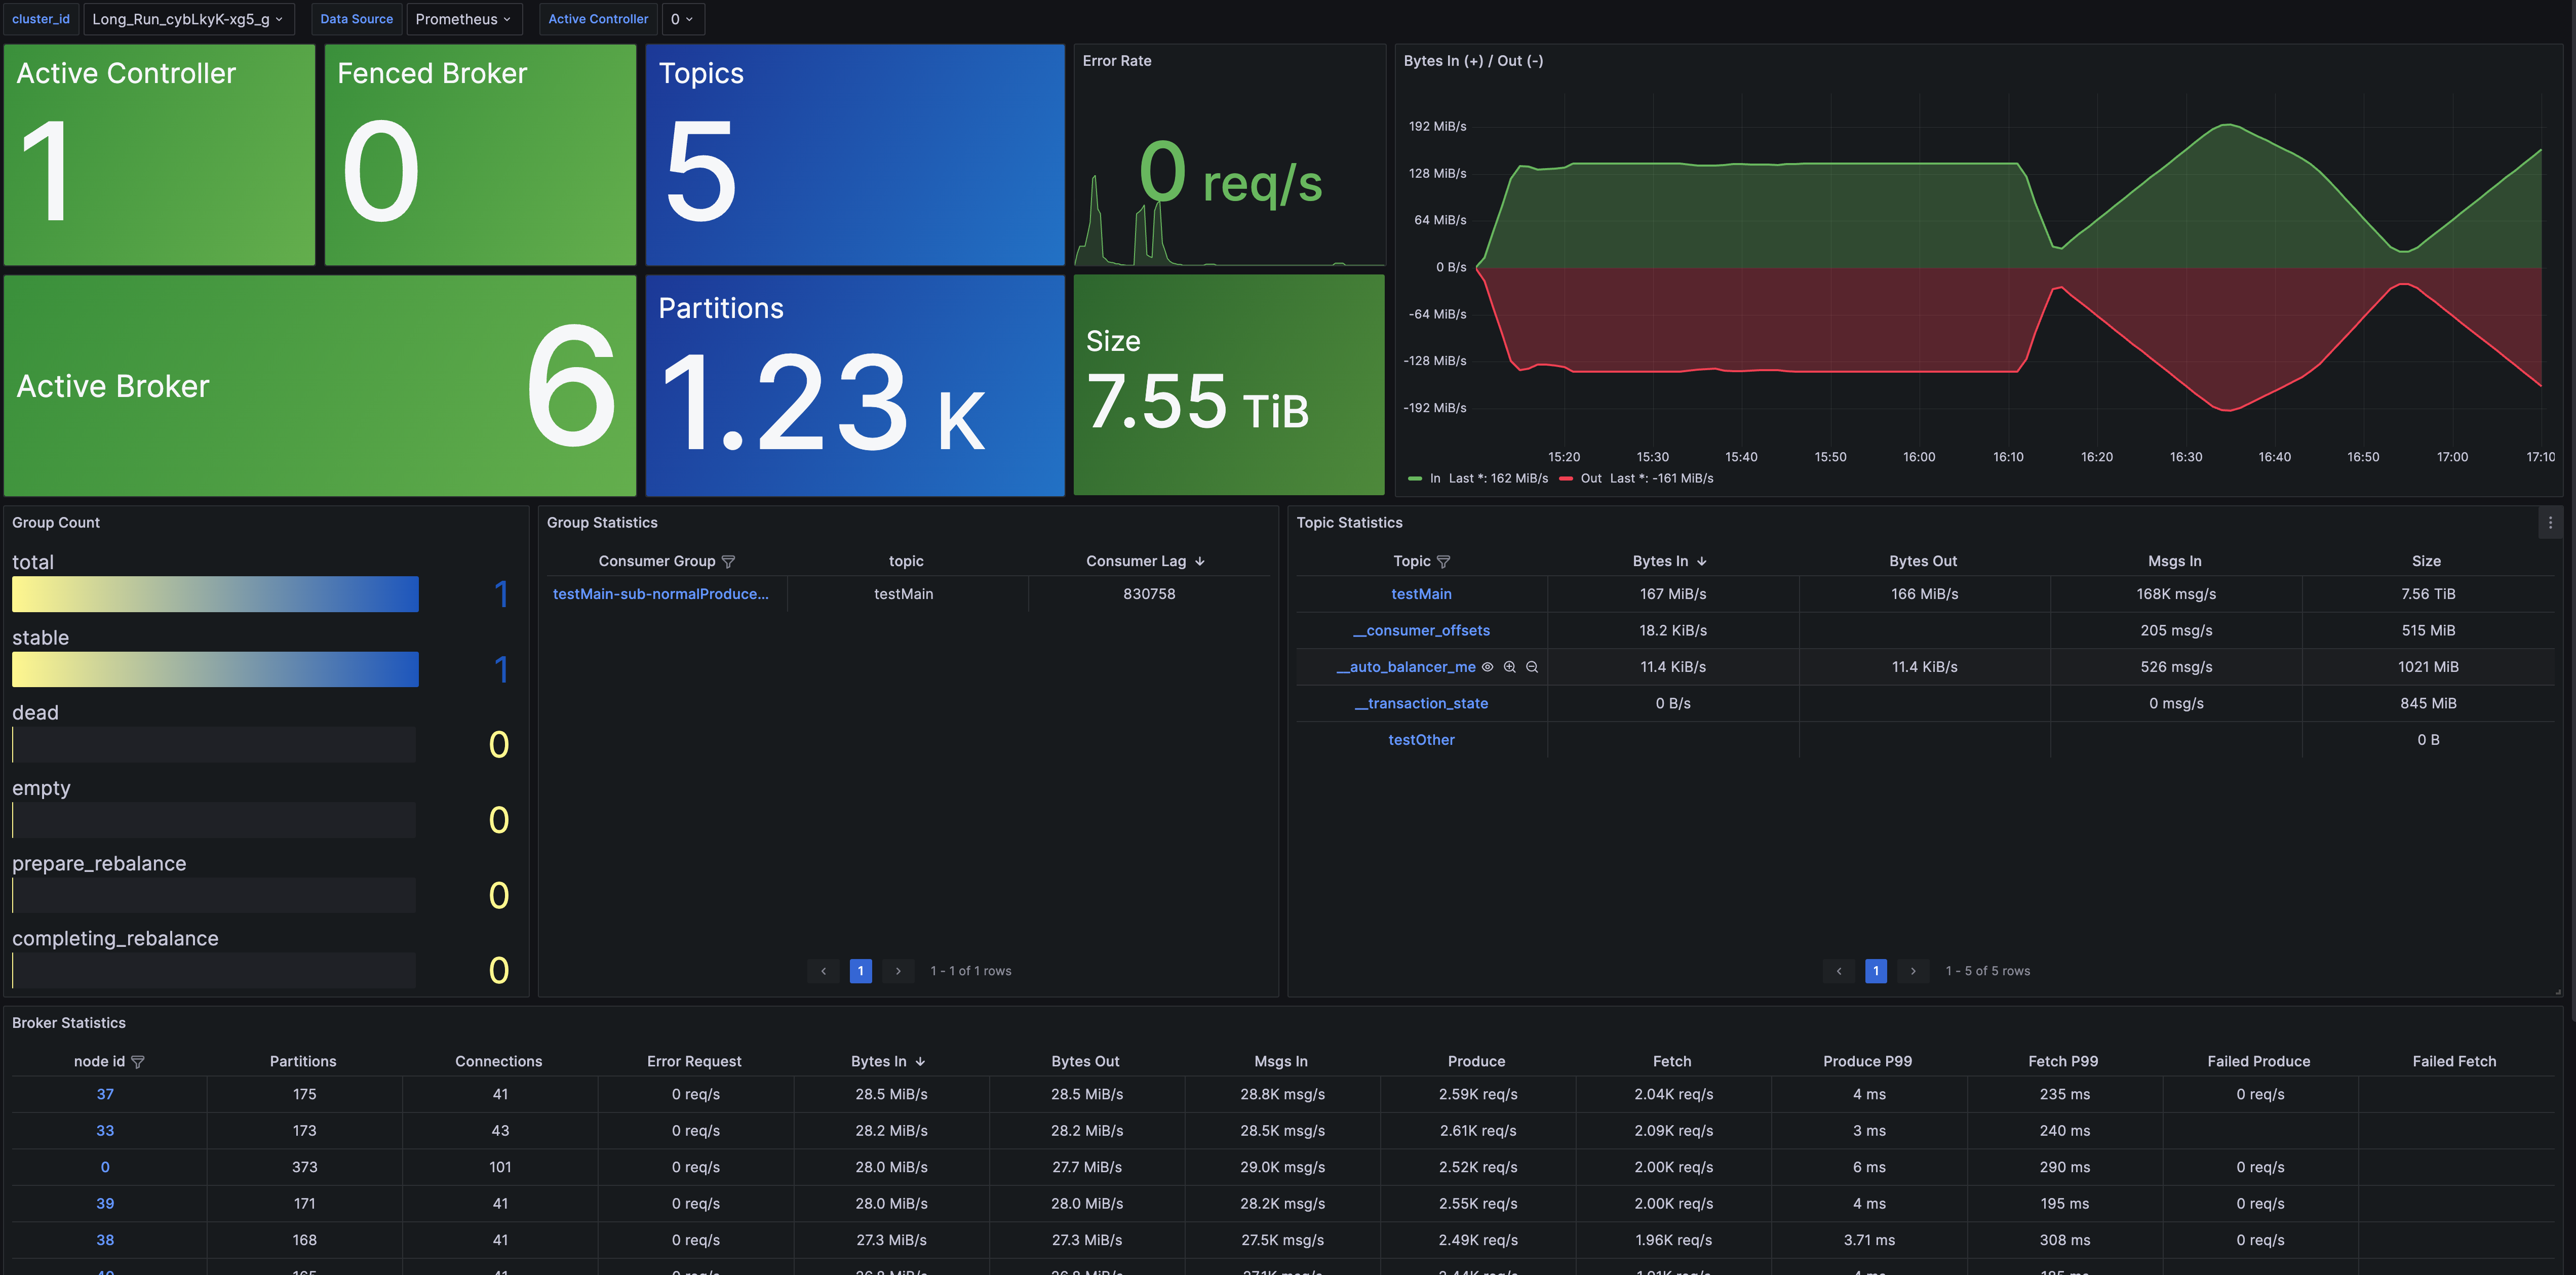
The pre-configured Grafana dashboard templates offer metric monitoring across different dimensions:
- Cluster Overview: Provides cluster-level monitoring, including node count, data size, cluster traffic, etc. It also includes metric overviews for Topic, Group, and Broker dimensions and offers drill-down capabilities for detailed monitoring.
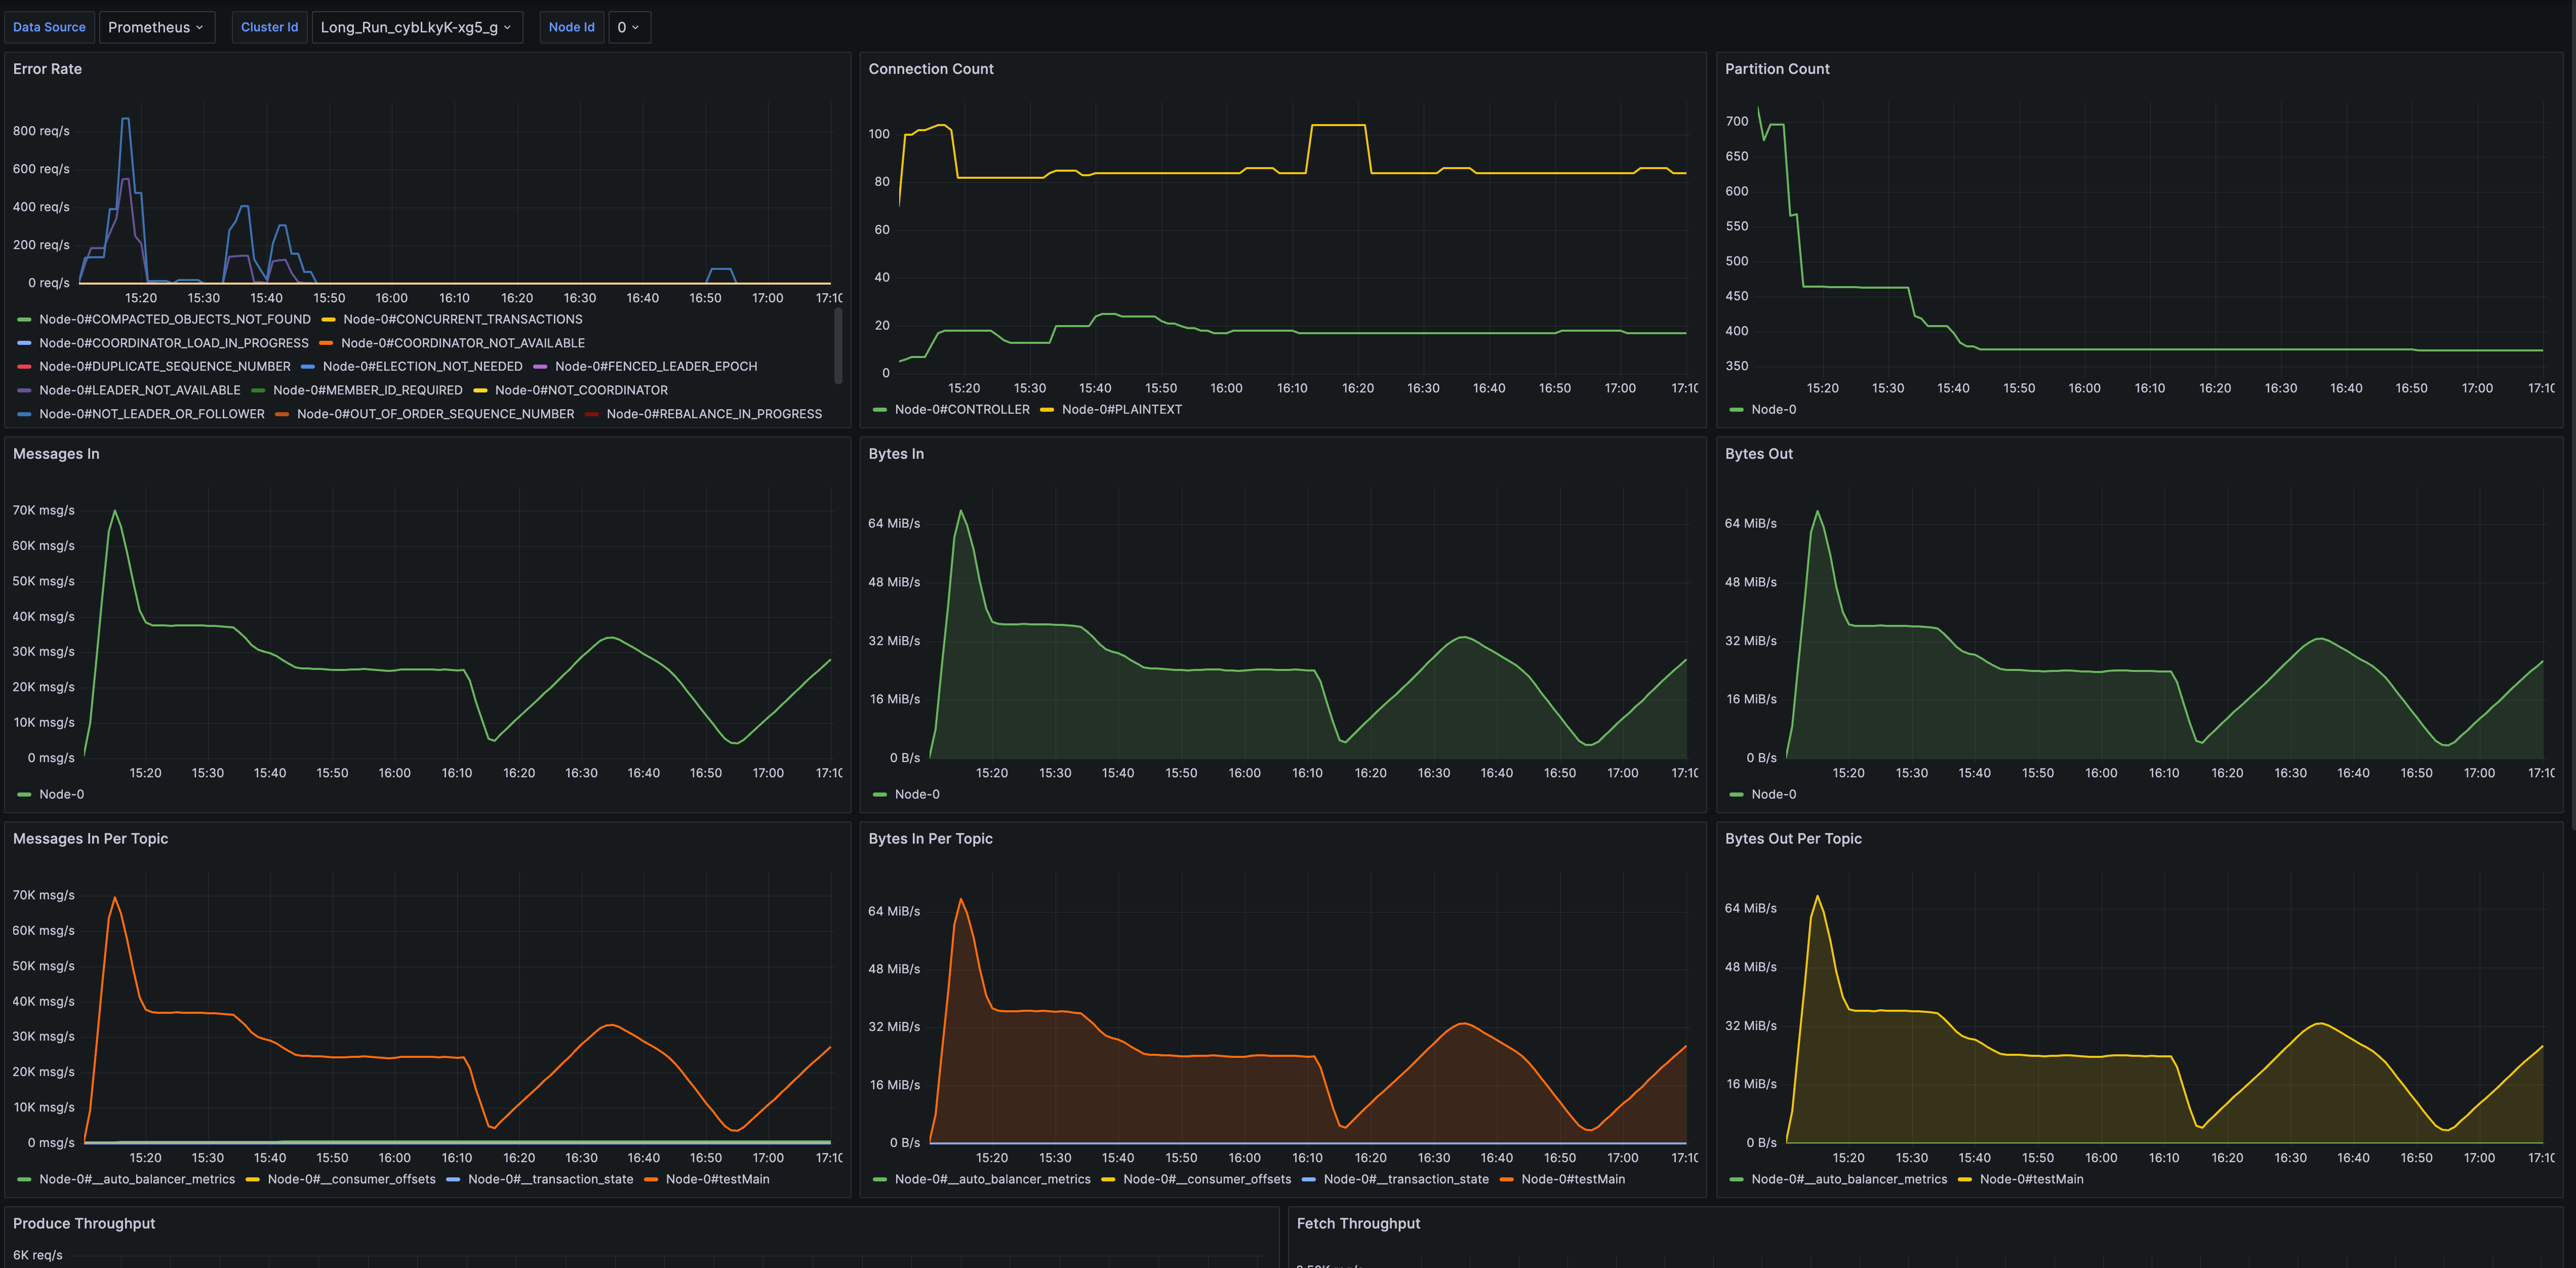
- Broker Metrics: Offers broker-level monitoring, including connection count, partition count, node traffic, node requests, and more.
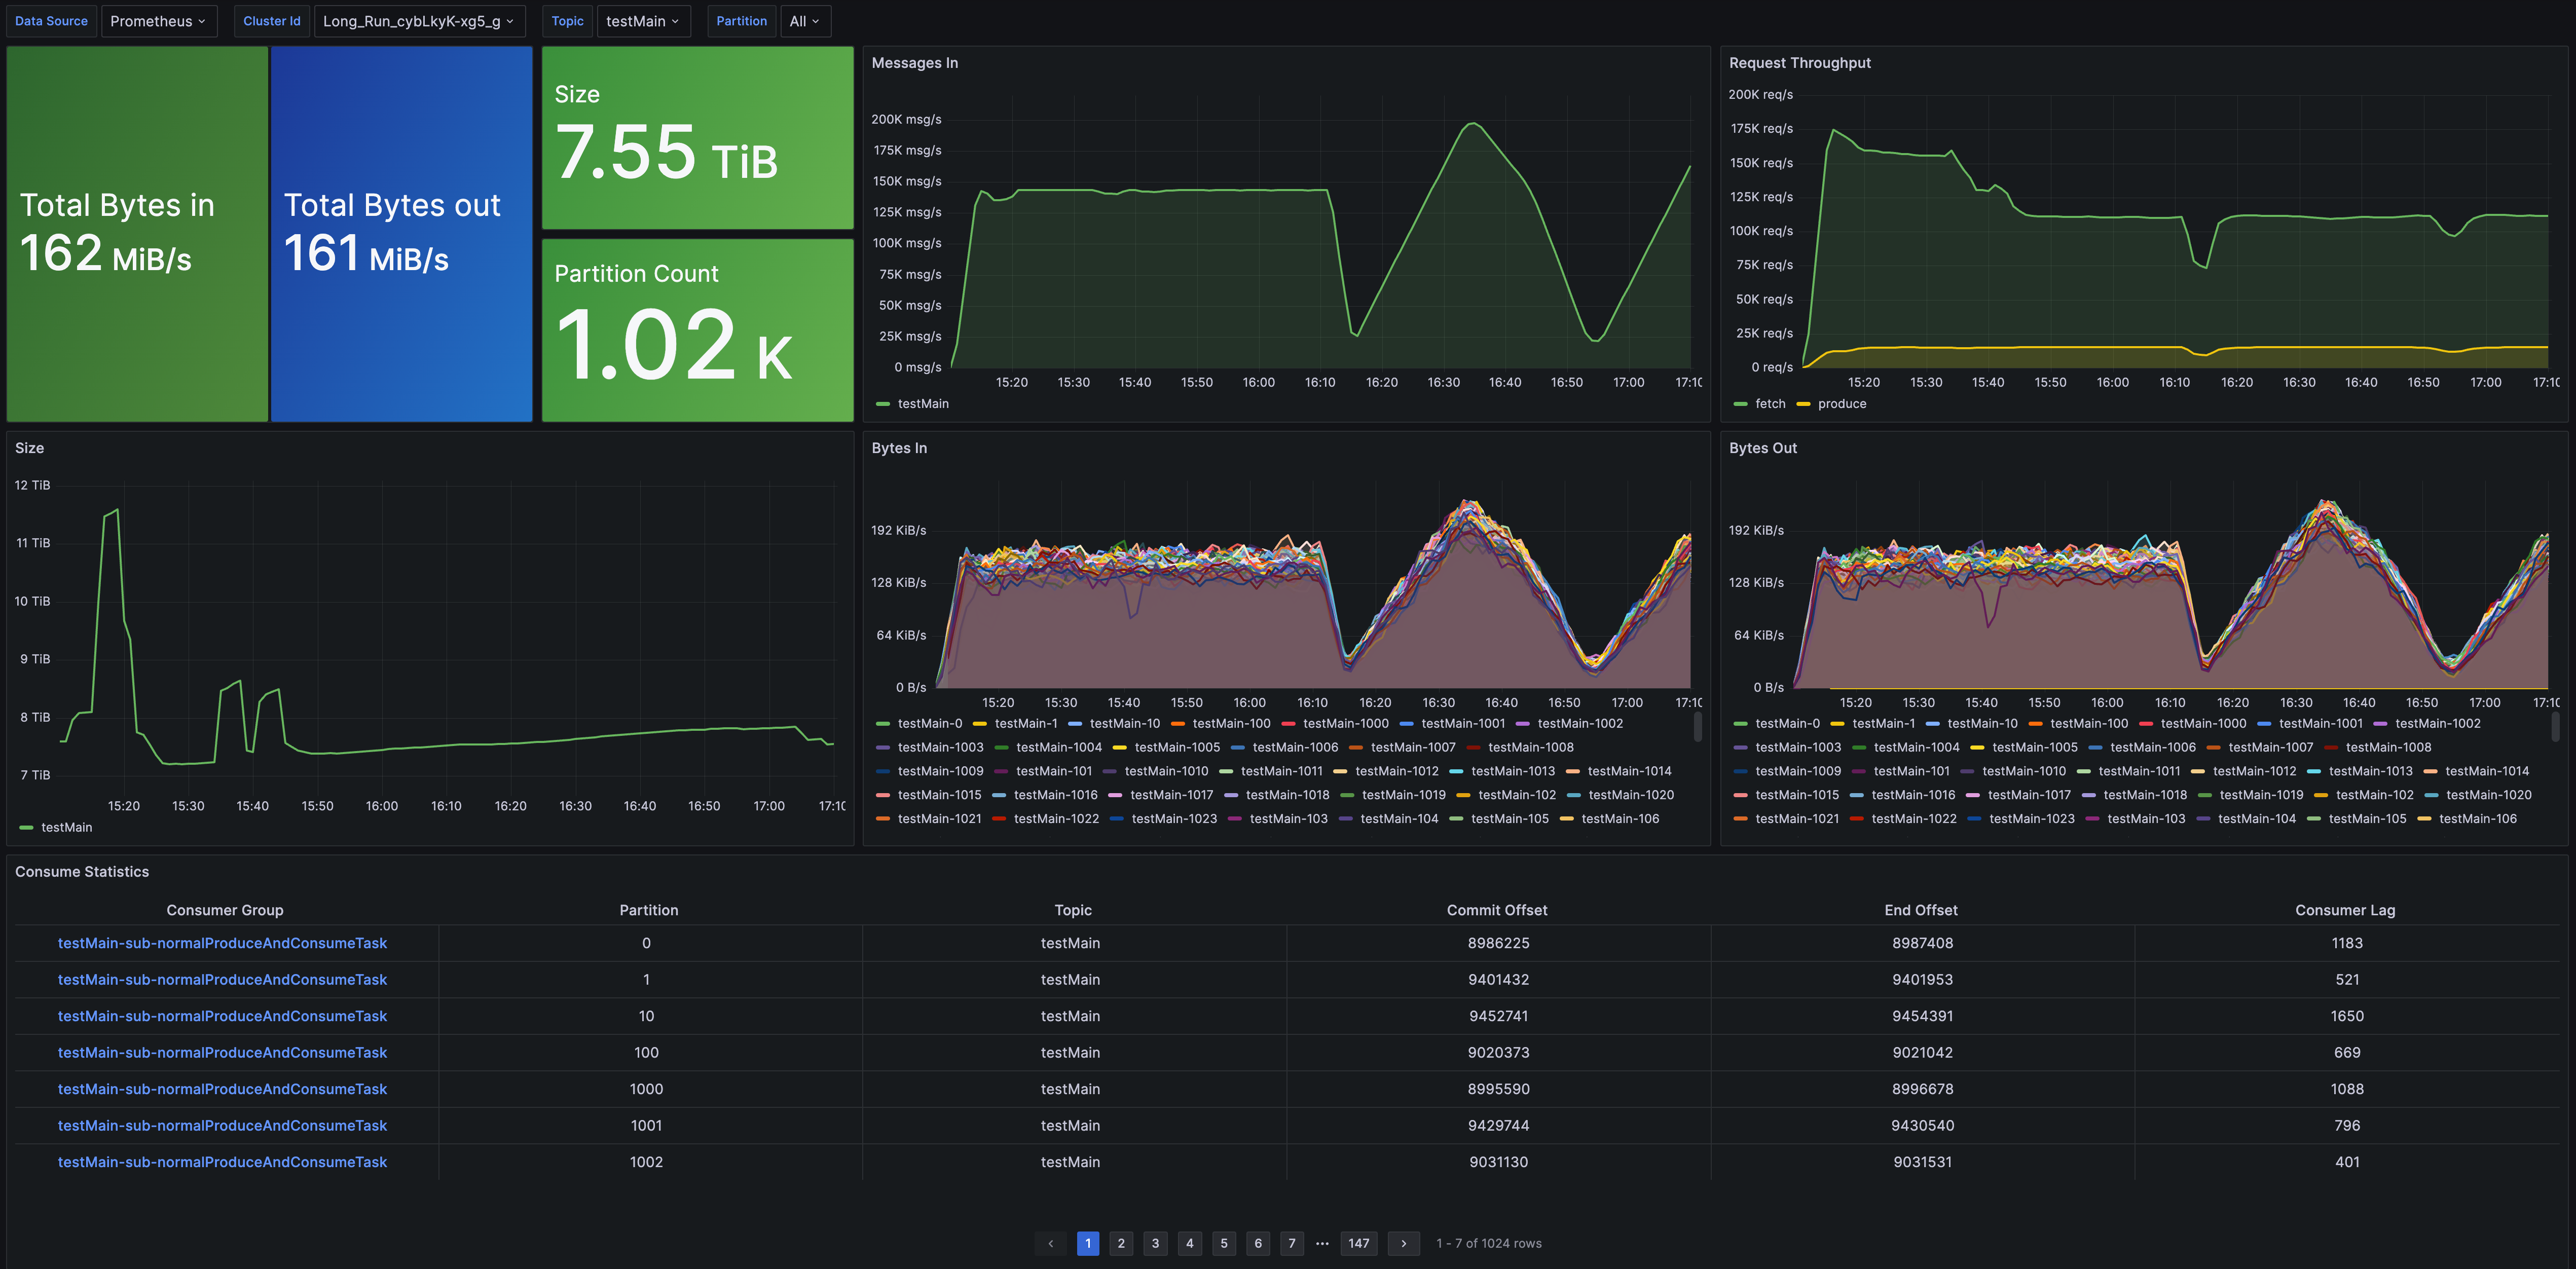
- Topic Metrics: Provides topic-level metric monitoring, including message throughput, total data volume, partition count, and consumption latency.
- Group Metrics: Delivers group-level metric monitoring, including consumption rate and consumption latency.
Business Monitoring and Alerts
AutoMQ integrates with Prometheus to push metrics data to Prometheus. Users can then configure custom alert rules in Prometheus to monitor for anomalies such as business stress levels.
Alert Templates
AutoMQ provides a series of alert templates based on high-frequency metrics usage in production environments. Users can choose and configure these alert rules according to their actual needs.
The list of alert rule templates is as follows:
| Alert Rule Item | Function and Scenario |
|---|---|
| HighTopicBytesInPerSec |
|
| HighTopicBytesInPerSecDayToDayChange |
|
| LowTopicBytesInPerSec |
|
| LowTopicBytesInPerSecDayToDayChange |
|
| HighTopicBytesOutPerSec |
|
| HighTopicBytesOutPerSecDayToDayChange |
|
| LowTopicBytesOutPerSec |
|
| LowTopicBytesOutPerSecDayToDayChange |
|
| HighGroupConsumeRatePerTopic |
|
| LowGroupConsumeRatePerTopic |
|
| HighGroupConsumerLag |
|
A complete alert template YAML file can be found below for copying and importing.
# This Is the Alert Rules Template for AutoMQ, Please Modify the Alert Thresholds and Period Per Your Needs
# Before Applying It to Your Production Environment.
groups:
  - name: kafka_alerts
    rules:
      - alert: HighTopicBytesInPerSec
        expr: sum(max(rate(kafka_network_io_bytes_total{direction="in", topic="example_topic"}[1m])) by (job, topic, partition)) by (job, topic) > 50 * 1024 * 1024
        for: 5m
        labels:
          severity: warning
        annotations:
          summary: "High inbound network throughput {{ printf \"%0.2f\" $value }} Bytes/s for topic {{ $labels.topic }} in cluster {{ $labels.job }}"
          description: "The inbound bytes per second produced by topic {{ $labels.topic }} in cluster {{ $labels.job }} is exceeding threshold."

      - alert: LowTopicBytesInPerSec
        expr: sum(max(rate(kafka_network_io_bytes_total{direction="in", topic="example_topic"}[1m])) by (job, topic, partition)) by (job, topic) < 1024
        for: 5m
        labels:
          severity: warning
        annotations:
          summary: "Low inbound network throughput {{ printf \"%0.2f\" $value }} Bytes/s for topic {{ $labels.topic }} in cluster {{ $labels.job }}"
          description: "The inbound bytes per second produced by topic {{ $labels.topic }} in cluster {{ $labels.job }} is below threshold."

      - alert: HighTopicBytesOutPerSec
        expr: sum(max(rate(kafka_network_io_bytes_total{direction="out", topic="example_topic"}[1m])) by (job, topic, partition)) by (job, topic) > 50 * 1024 * 1024
        for: 5m
        labels:
          severity: warning
        annotations:
          summary: "High outbound network throughput {{ printf \"%0.2f\" $value }} Bytes/s for topic {{ $labels.topic }} in cluster {{ $labels.job }}"
          description: "The outbound bytes per second produced by topic {{ $labels.topic }} in cluster {{ $labels.job }} is exceeding threshold."

      - alert: LowTopicBytesOutPerSec
        expr: sum(max(rate(kafka_network_io_bytes_total{direction="out", topic="example_topic"}[1m])) by (job, topic, partition)) by (job, topic) < 1024
        for: 5m
        labels:
          severity: warning
        annotations:
          summary: "Low outbound network throughput {{ printf \"%0.2f\" $value }} Bytes/s for topic {{ $labels.topic }} in cluster {{ $labels.job }}"
          description: "The outbound bytes per second produced by topic {{ $labels.topic }} in cluster {{ $labels.job }} is below threshold."

      - alert: HighGroupConsumeRatePerTopic
        expr: sum(max(rate(kafka_group_commit_offset{consumer_group="example_group", topic="example_topic"}[1m])) by (job, consumer_group, topic, partition)) by (job, consumer_group, topic) > 1000
        for: 5m
        labels:
          severity: warning
        annotations:
          summary: "High group consume rate {{ printf \"%0.2f\" $value }} msg/s for consumer group {{ $labels.consumer_group }} on topic {{ $labels.topic }} in cluster {{ $labels.job }}"
          description: "The consume rate of consumer group {{ $labels.consumer_group }} on topic {{ $labels.topic }} in cluster {{ $labels.job }} is exceeding threshold."

      - alert: LowGroupConsumeRatePerTopic
        expr: sum(max(rate(kafka_group_commit_offset{consumer_group="example_group", topic="example_topic"}[1m])) by (job, consumer_group, topic, partition)) by (job, consumer_group, topic) < 10
        for: 5m
        labels:
          severity: warning
        annotations:
          summary: "Low group consume rate {{ printf \"%0.2f\" $value }} msg/s for consumer group {{ $labels.consumer_group }} on topic {{ $labels.topic }} in cluster {{ $labels.job }}"
          description: "The consume rate of consumer group {{ $labels.consumer_group }} on topic {{ $labels.topic }} in cluster {{ $labels.job }} is below threshold."

      - alert: HighTopicBytesInPerSecDayToDayChange
        expr: (sum(max(rate(kafka_network_io_bytes_total{direction="in", topic="example_topic"}[1m])) by (job, topic, partition)) by (job, topic)
          - sum(max(rate(kafka_network_io_bytes_total{direction="in", topic="example_topic"}[1m] offset 24h)) by (job, topic, partition)) by (job, topic))
          / sum(max(rate(kafka_network_io_bytes_total{direction="in", topic="example_topic"}[1m] offset 24h)) by (job, topic, partition)) by (job, topic) > 0.2
        for: 5m
        labels:
          severity: warning
        annotations:
          summary: "High inbound network throughput change {{ printf \"%0.2f\" $value }} for topic {{ $labels.topic }} in cluster {{ $labels.job }}"
          description: "The increase of inbound bytes per second produced by topic {{ $labels.topic }} in cluster {{ $labels.job }} compared to 24h ago is exceeding threshold"

      - alert: LowTopicBytesInPerSecDayToDayChange
        expr: (sum(max(rate(kafka_network_io_bytes_total{direction="in", topic="example_topic"}[1m])) by (job, topic, partition)) by (job, topic)
          - sum(max(rate(kafka_network_io_bytes_total{direction="in", topic="example_topic"}[1m] offset 24h)) by (job, topic, partition)) by (job, topic))
          / sum(max(rate(kafka_network_io_bytes_total{direction="in", topic="example_topic"}[1m] offset 24h)) by (job, topic, partition)) by (job, topic) < -0.2
        for: 5m
        labels:
          severity: warning
        annotations:
          summary: "Low inbound network throughput change {{ printf \"%0.2f\" $value }} for topic {{ $labels.topic }} in cluster {{ $labels.job }}"
          description: "The decrease of inbound bytes per second produced by topic {{ $labels.topic }} in cluster {{ $labels.job }} compared to 24h ago is exceeding threshold"

      - alert: HighTopicBytesOutPerSecDayToDayChange
        expr: (sum(max(rate(kafka_network_io_bytes_total{direction="out", topic="example_topic"}[1m])) by (job, topic, partition)) by (job, topic)
          - sum(max(rate(kafka_network_io_bytes_total{direction="out", topic="example_topic"}[1m] offset 24h)) by (job, topic, partition)) by (job, topic))
          / sum(max(rate(kafka_network_io_bytes_total{direction="out", topic="example_topic"}[1m] offset 24h)) by (job, topic, partition)) by (job, topic) > 0.2
        for: 5m
        labels:
          severity: warning
        annotations:
          summary: "High outbound network throughput change {{ printf \"%0.2f\" $value }} for topic {{ $labels.topic }} in cluster {{ $labels.job }}"
          description: "The increase of outbound bytes per second produced by topic {{ $labels.topic }} in cluster {{ $labels.job }} compared to 24h ago is exceeding threshold"

      - alert: LowTopicBytesOutPerSecDayToDayChange
        expr: (sum(max(rate(kafka_network_io_bytes_total{direction="out", topic="example_topic"}[1m])) by (job, topic, partition)) by (job, topic)
          - sum(max(rate(kafka_network_io_bytes_total{direction="out", topic="example_topic"}[1m] offset 24h)) by (job, topic, partition)) by (job, topic))
          / sum(max(rate(kafka_network_io_bytes_total{direction="out", topic="example_topic"}[1m] offset 24h)) by (job, topic, partition)) by (job, topic) < -0.2
        for: 5m
        labels:
          severity: warning
        annotations:
          summary: "Low outbound network throughput change {{ printf \"%0.2f\" $value }} for topic {{ $labels.topic }} in cluster {{ $labels.job }}"
          description: "The decrease of outbound bytes per second produced by topic {{ $labels.topic }} in cluster {{ $labels.job }} compared to 24h ago is exceeding threshold"

      - alert: HighGroupConsumerLag
        expr: sum(max(kafka_log_end_offset{topic="example_topic"}) by (job, topic, partition)) by (job, topic)
          - on (topic) group_left (consumer_group) sum(max(kafka_group_commit_offset{consumer_group="example_group", topic="example_topic"}) by (job, consumer_group, topic, partition)) by (job, consumer_group, topic) > 10000
        for: 1m
        labels:
          severity: warning
        annotations:
          summary: "High group consumer lag {{ printf \"%0.f\" $value }} for consumer group {{ $labels.consumer_group }} in cluster {{ $labels.job }} on topic {{ $labels.topic }}."
          description: "The consumer lag of consumer group {{ $labels.consumer_group }} in cluster {{ $labels.job }} on topic {{ $labels.topic }} is exceeding threshold."
Configuration Steps
AutoMQ provides the above Prometheus alert template. Users can import this alert template into their current Prometheus cluster (instance) and then configure custom alert rules based on the template.
The following example uses Alibaba Cloud Prometheus to demonstrate the configuration method. If you are using a self-hosted Prometheus, adjust accordingly.
Configuring Alerts in Alibaba Cloud Prometheus
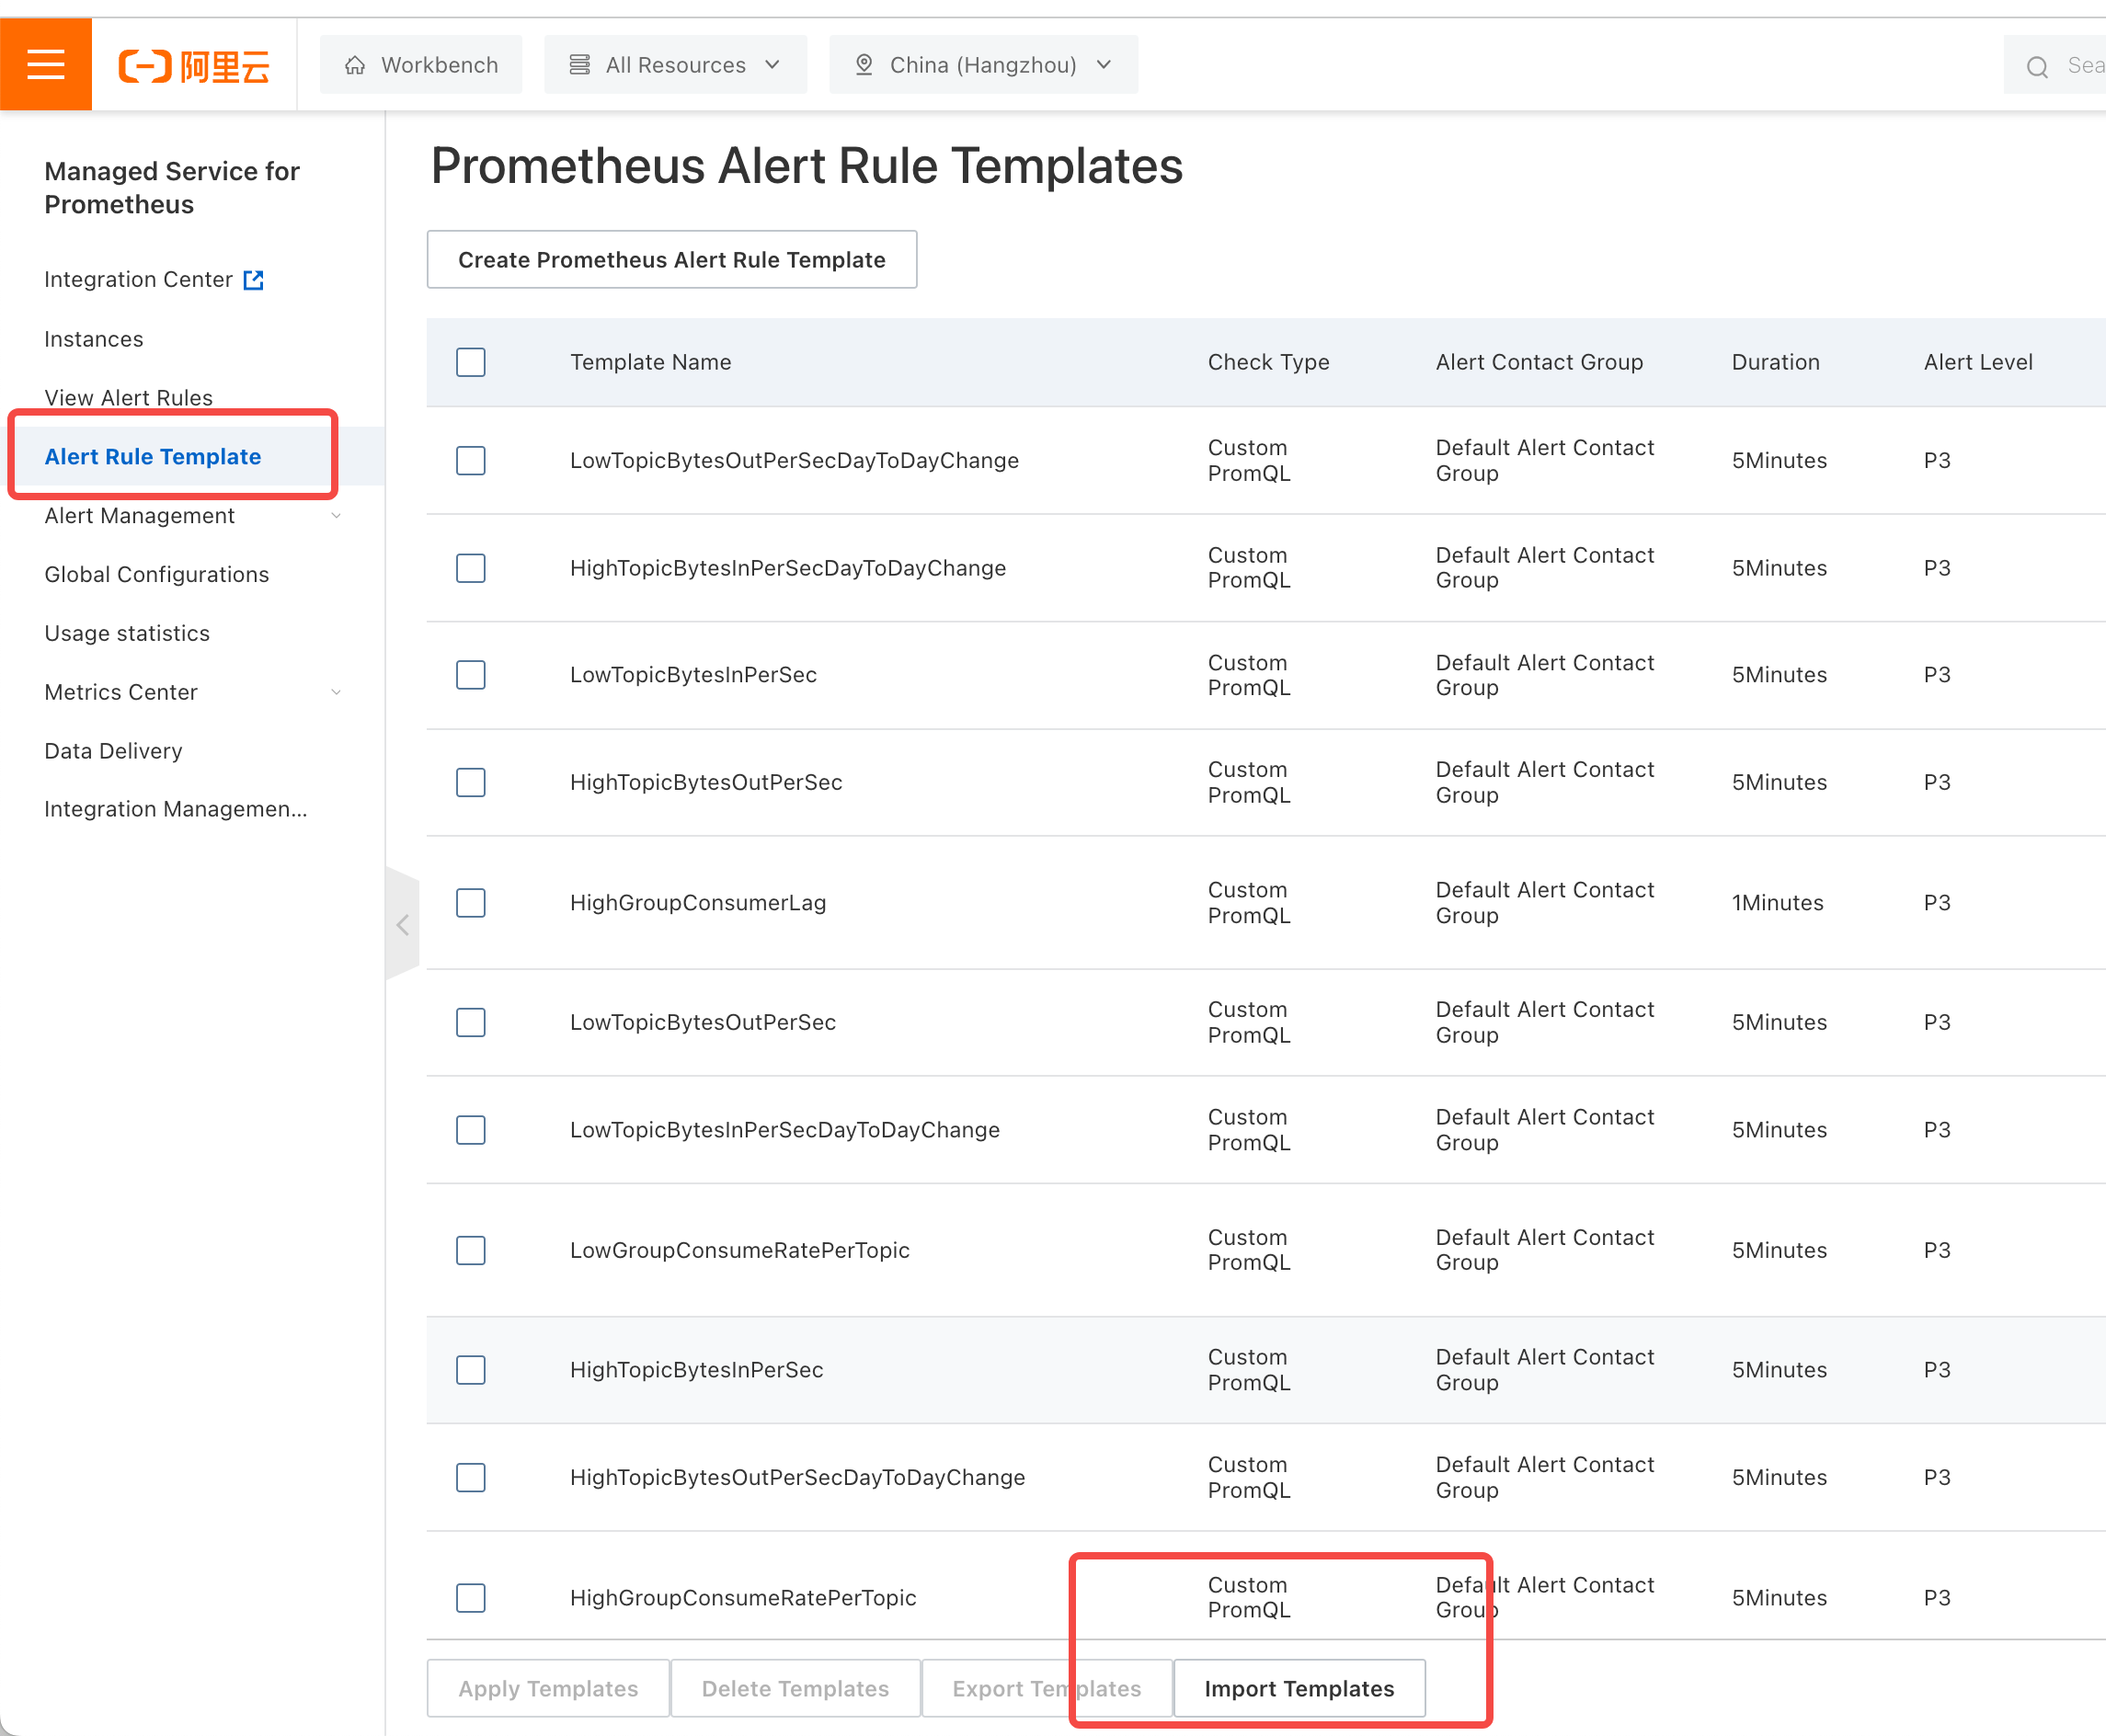
- Import the alert template: Open the Alibaba Cloud Prometheus Console, go to Alert Rule Templates, and select Batch Import Template.
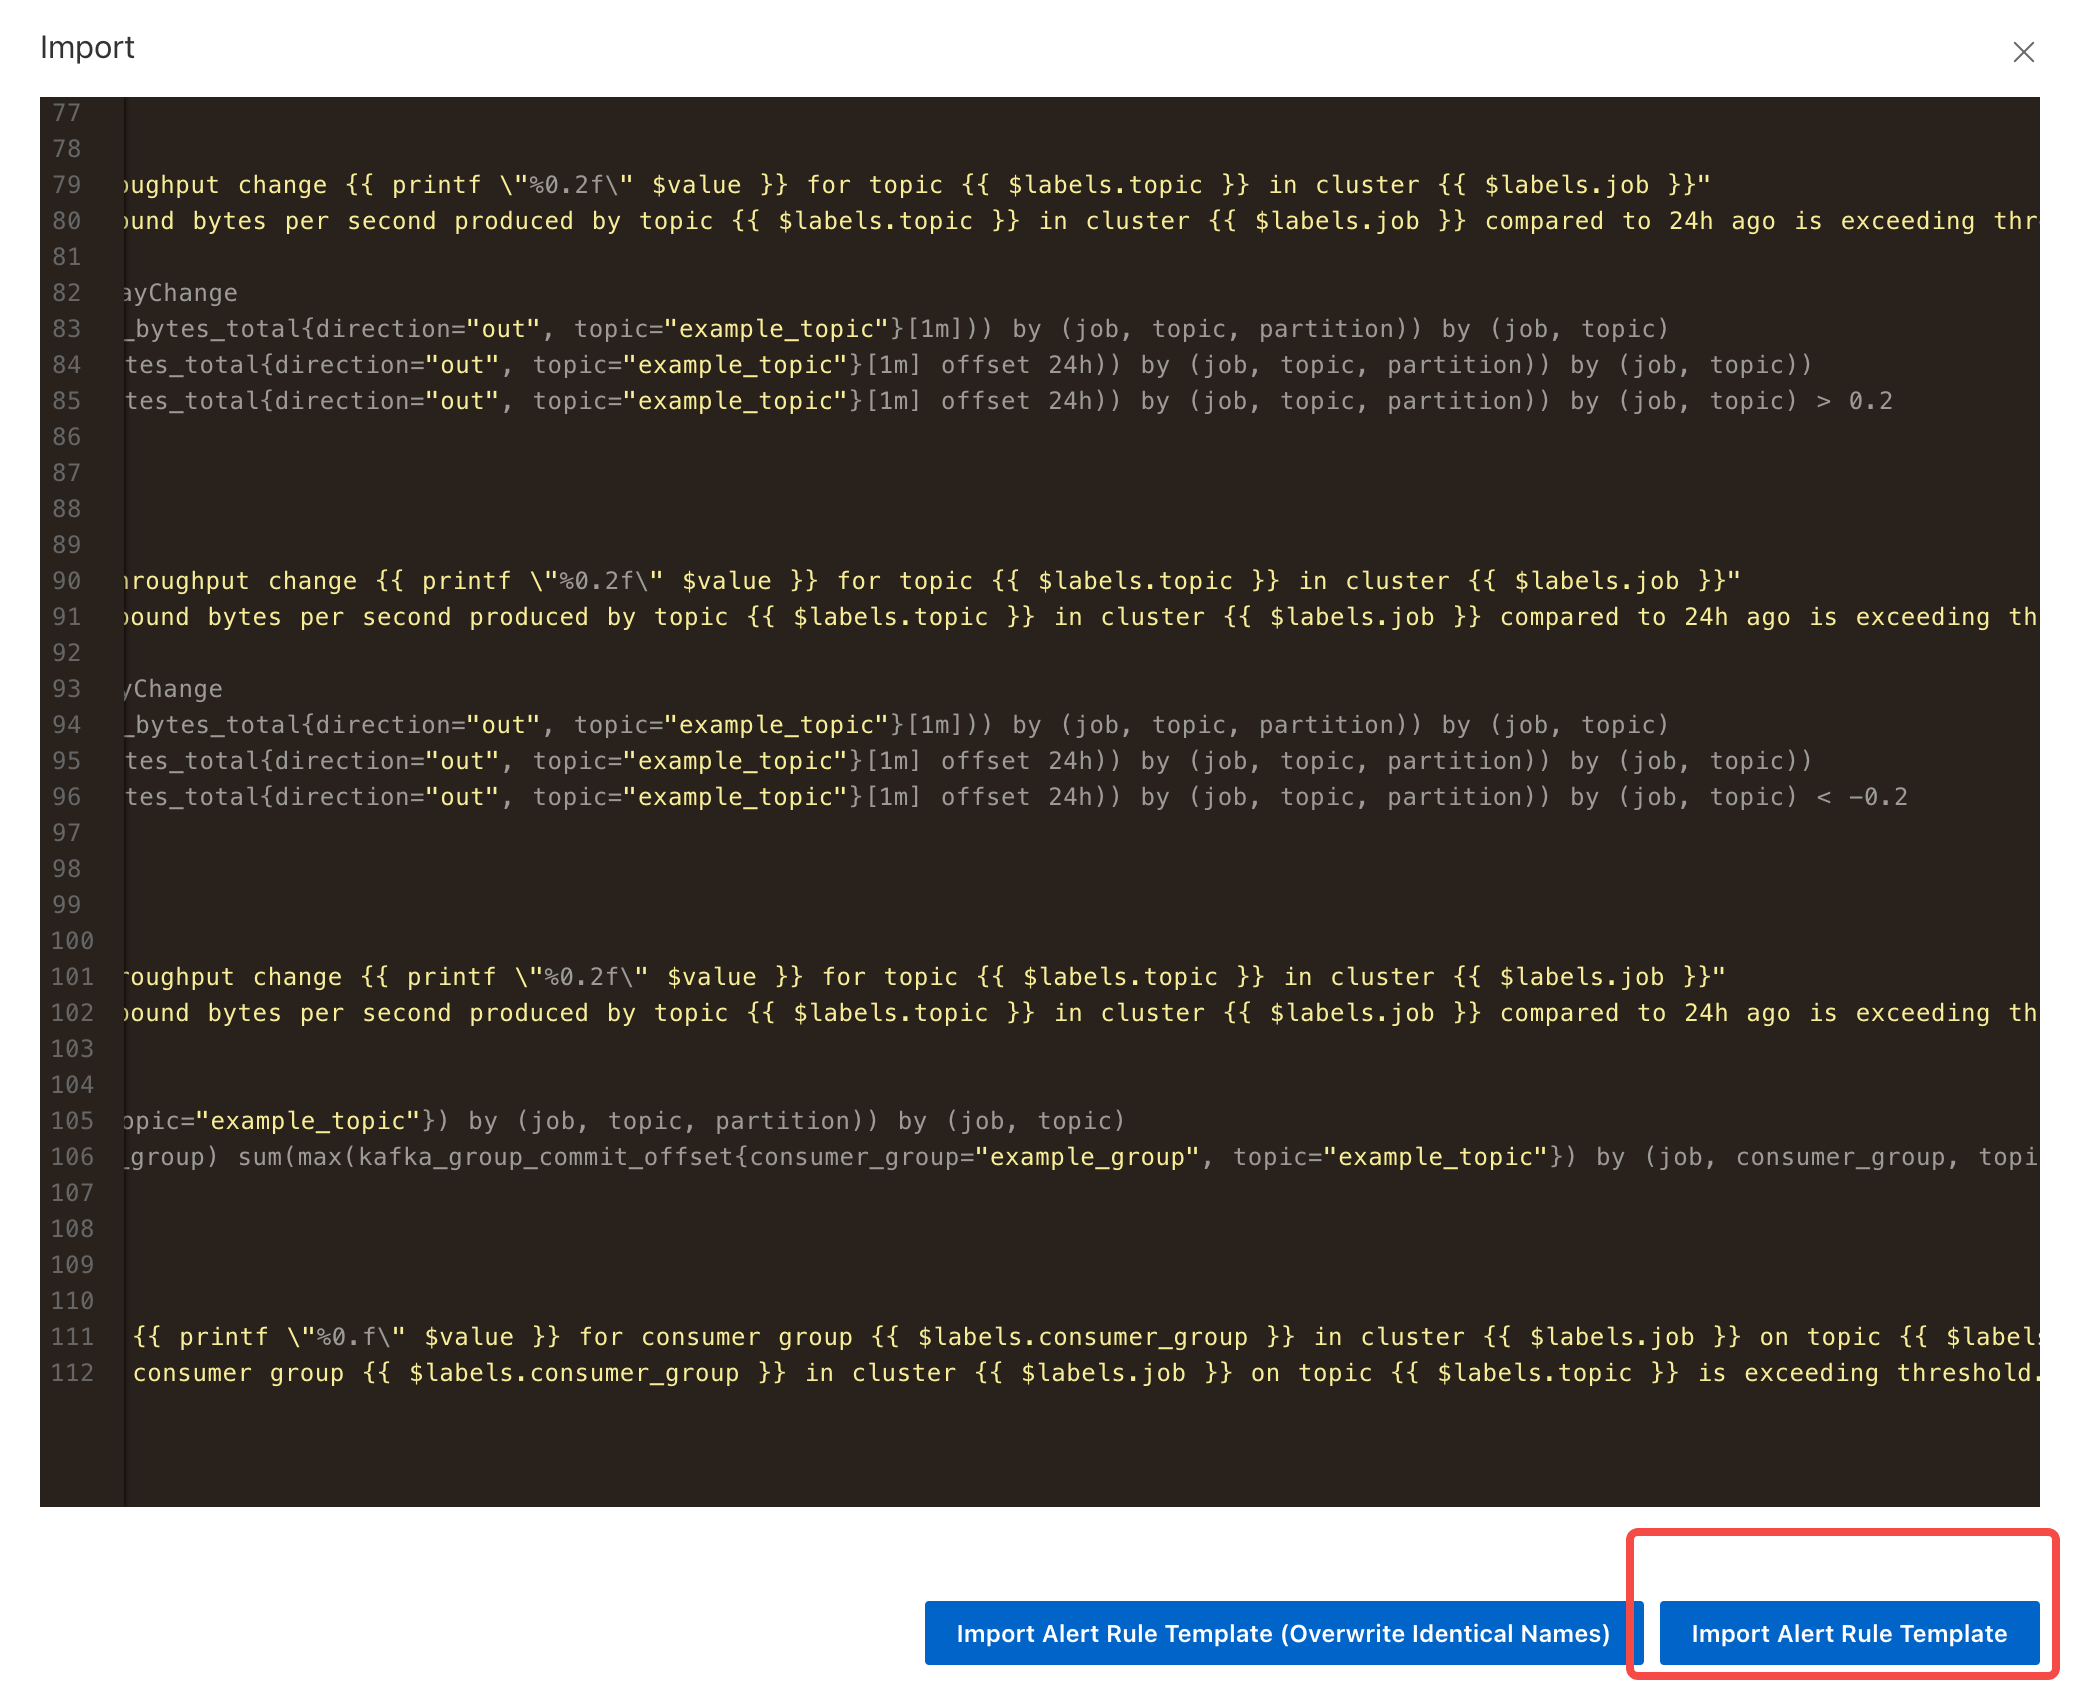
- Copy the content of the above template file and import it.
- Apply Alert Template: After importing the template, select the specific alert template and click Apply Template to apply the desired alert template to the corresponding Prometheus instance.
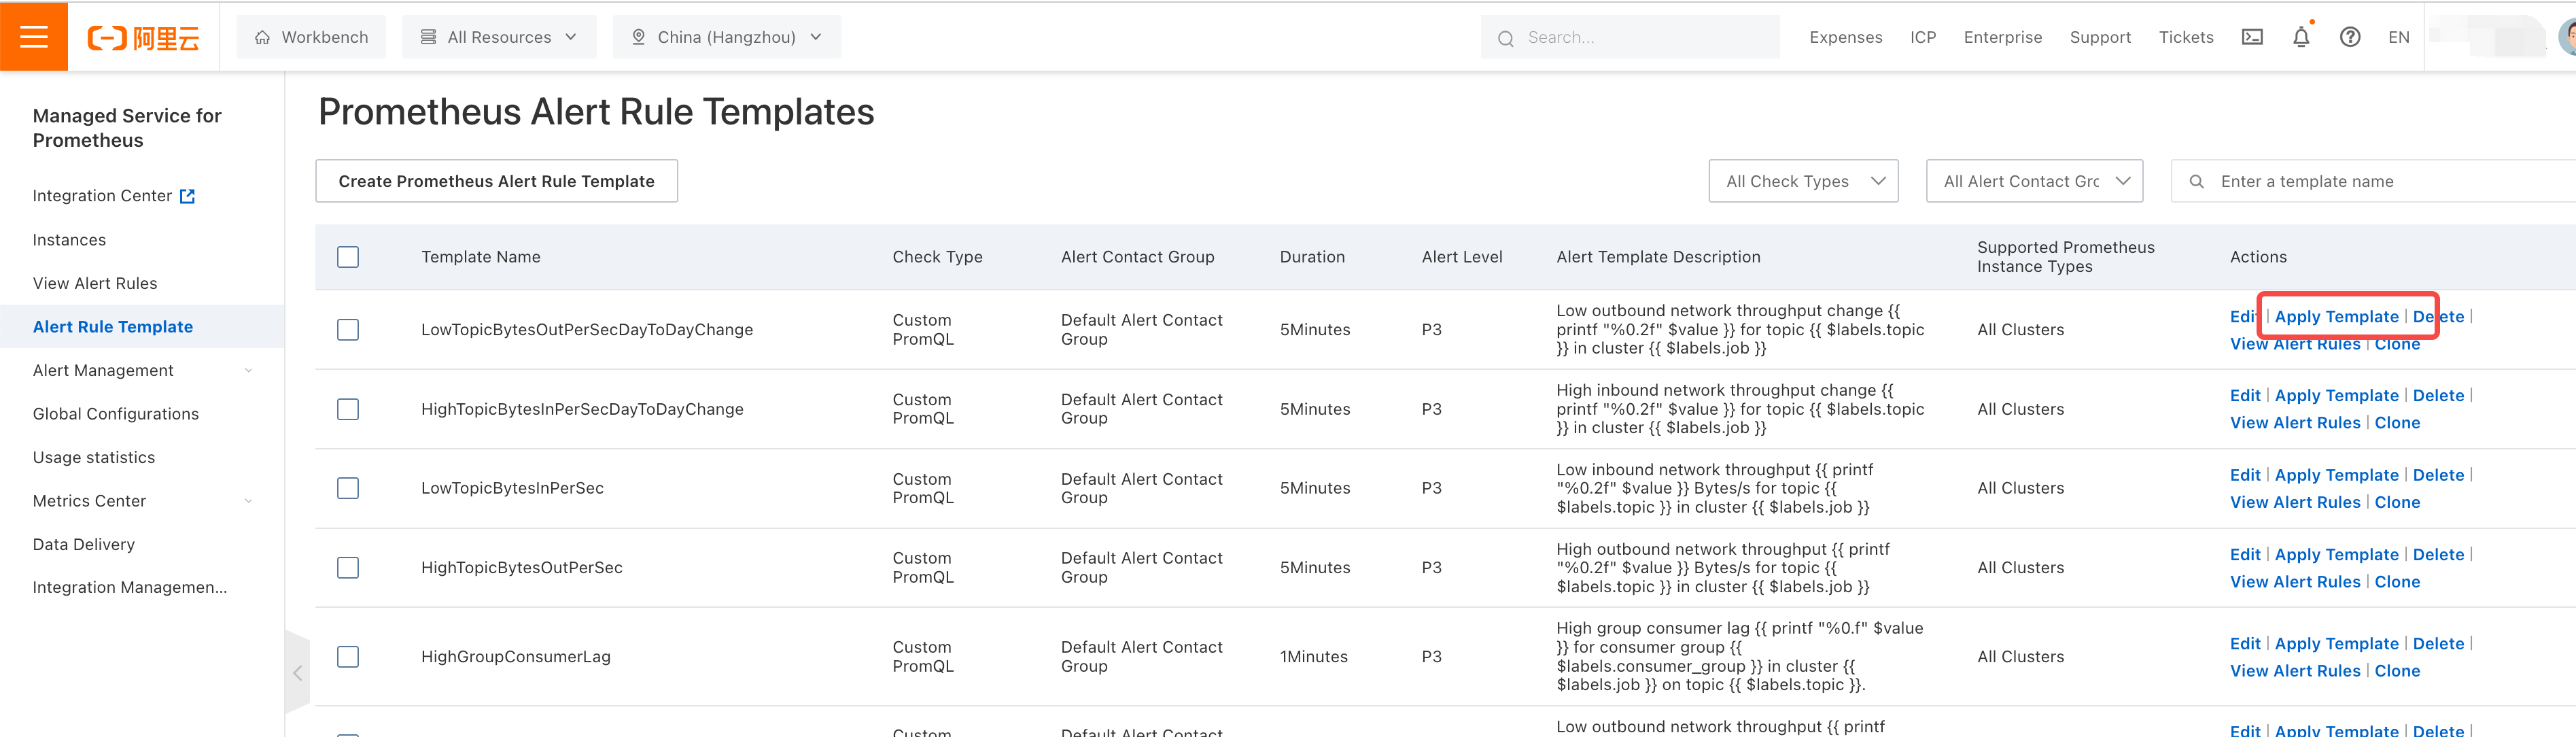
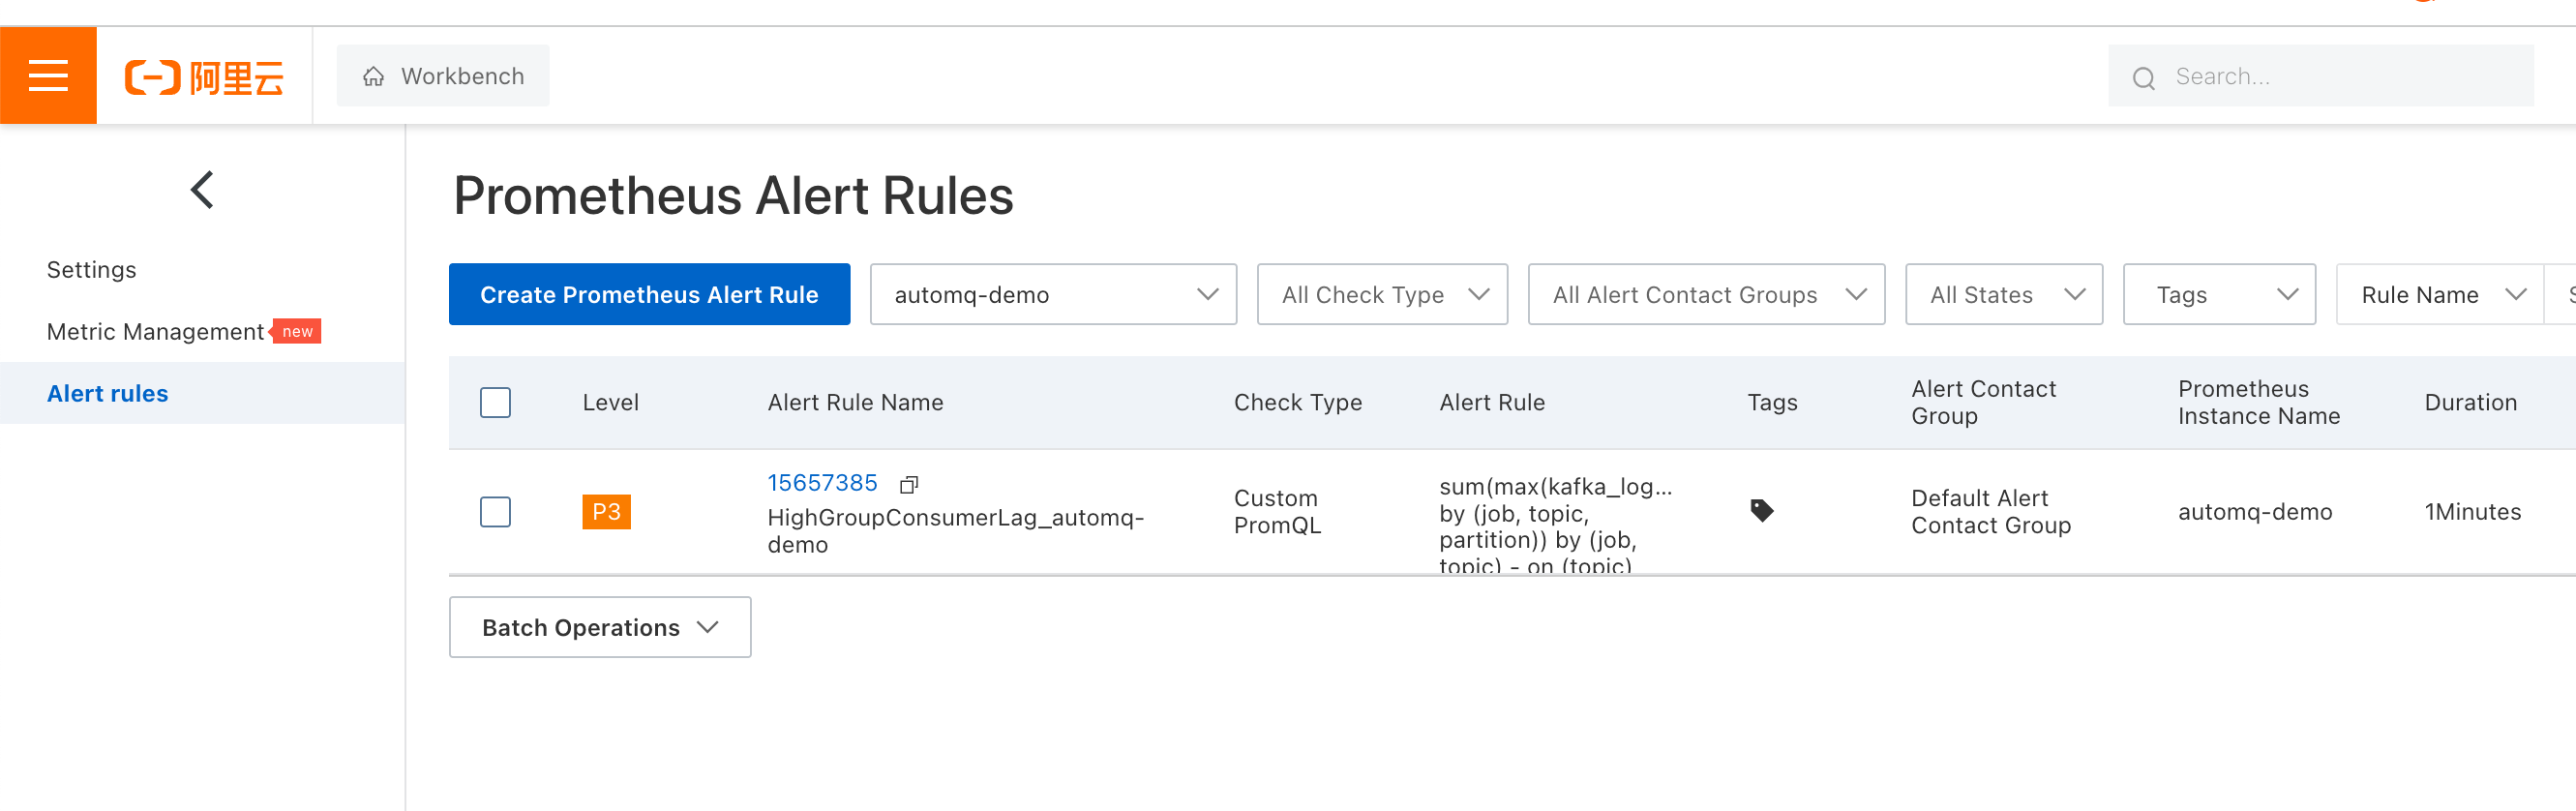
- Configure Monitoring and Alert Rules: Take the HighGroupConsumerLag alert as an example. After clicking "Apply Template," select the corresponding Prometheus instance. Once applied successfully, you can see the enabled alert rules in the "Alert Rules List" on the left side.
- Click "Edit" to enter the alert rule editing page. Change "example_topic" and "example_group" to the topic and consumer group you want to monitor, and modify the alert threshold (10000 in the image below) to your desired value.
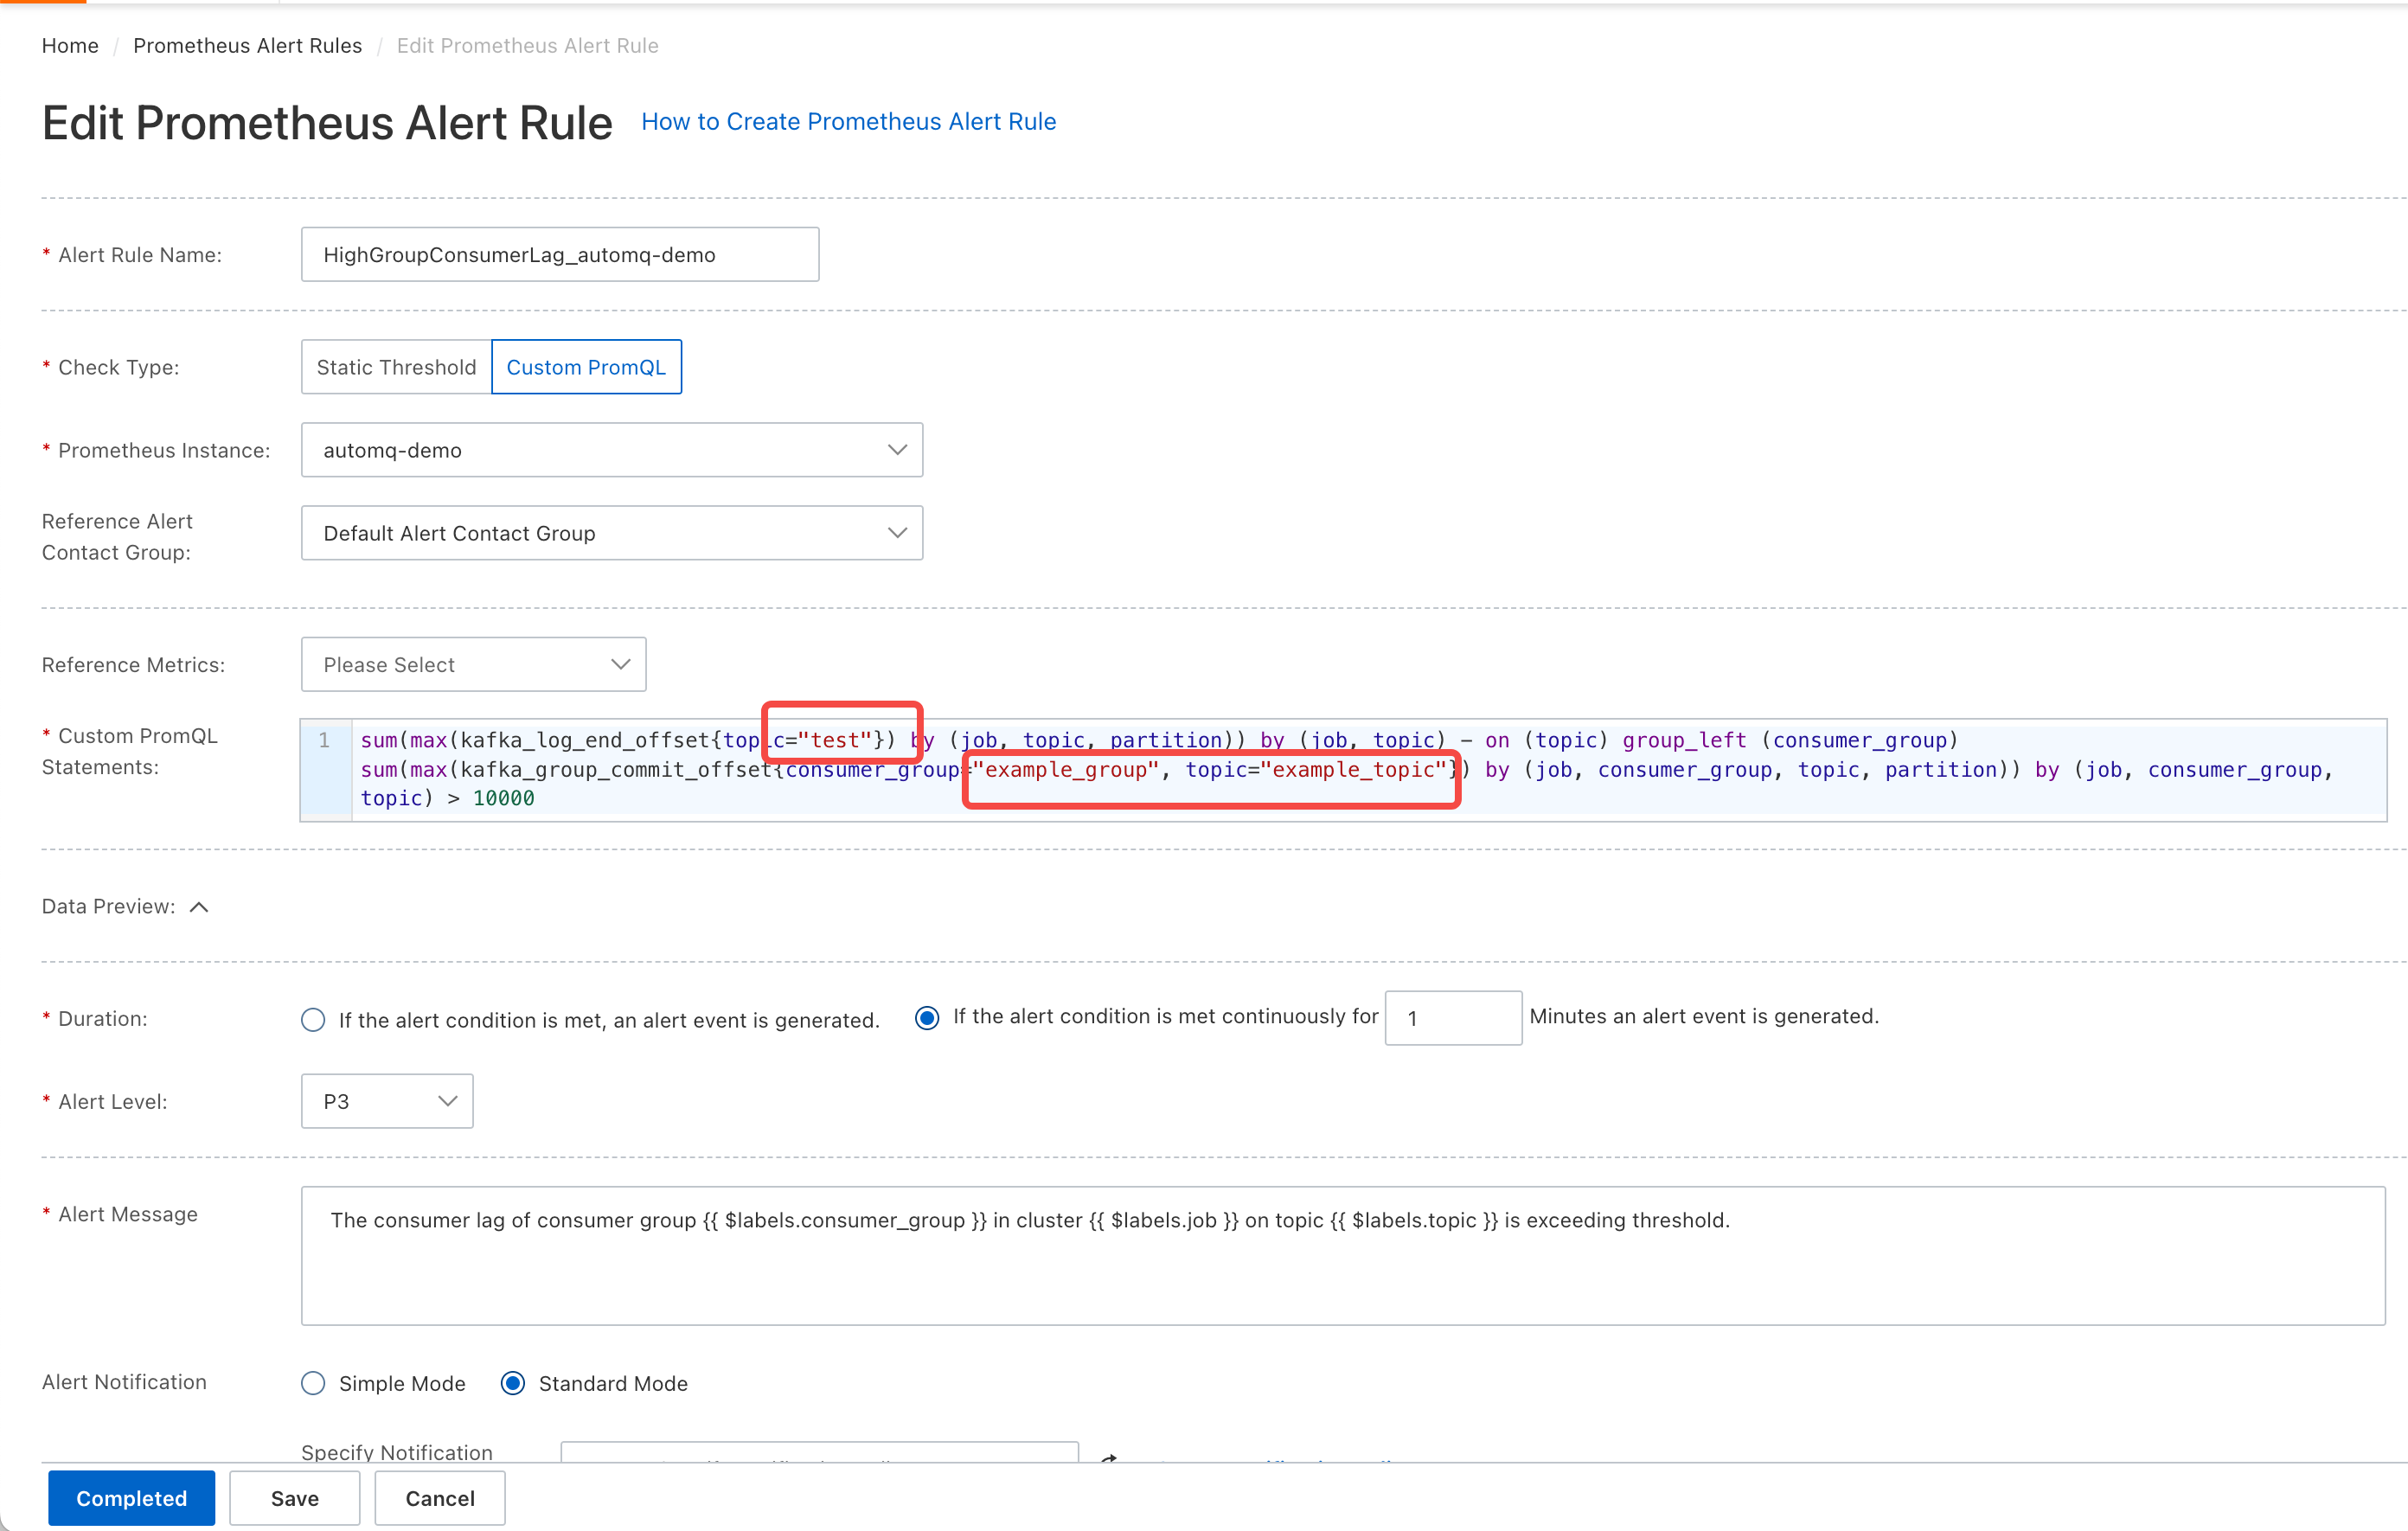
Configure Notification Policy: After editing, select an existing notification policy or click "Create New Notification Policy" to create one.
Quickly Copy Alert Policies (Optional): If you want to monitor multiple topics or consumer groups, you can click "Copy" to create multiple alert rules.