- Kubernetes:使用 Datadog Agent Helm chart 的 OTEL Agent Gateway,通过 Kubernetes 服务发现抓取 AutoMQ Pod 的 Prometheus 指标。
- Linux:使用运行在 Linux 上的 Gateway OTEL Collector 或 Datadog DDOT Collector 抓取 AutoMQ 的 Prometheus metrics endpoint,并转发到 Datadog。
前提条件
- 已部署的 AutoMQ Cloud BYOC 集群。BYOC 集群默认会暴露 AutoMQ Prometheus metrics endpoint。
- 有效的 Datadog API Key
- Datadog Site URL(例如
datadoghq.com、us3.datadoghq.com、datadoghq.eu)
方式一:Kubernetes 环境使用 Datadog Agent Gateway
该方式下,Datadog Agent Helm chart 会运行一个 OTEL Agent Gateway Deployment。Gateway 通过 Kubernetes 服务发现抓取 AutoMQ Pod 的 Prometheus 指标,在写入 Datadog 前降低指标基数,然后导出到 Datadog。步骤 1:确认 AutoMQ 指标导出
通过 AutoMQ Cloud BYOC Console 创建的 Kubernetes 集群默认会在 AutoMQ broker 和 controller Pod 上暴露 Prometheus 指标。标准 BYOC 流程不需要手动修改 AutoMQ Helm values。如果你管理的是 Kubernetes AutoMQ Software 部署,并且需要手动启用指标导出,请参考 附录:为 Kubernetes Software 手动启用 AutoMQ 指标导出。
步骤 2:创建 Datadog Agent Gateway values 文件
创建datadog-values.yaml 文件,配置 OTEL Agent Gateway。Gateway 使用 Kubernetes 服务发现来查找 AutoMQ broker 和 controller Pod。
请将 <your-automq-namespace> 替换为 AutoMQ 集群所在的 Kubernetes namespace。如果需要让同一个 Datadog Agent 采集多个 AutoMQ namespace,请将每个 namespace 添加到 kubernetes_sd_configs.namespaces.names。
同一套采集 profile 可同时用于 AutoMQ Software 和 AutoMQ Cloud BYOC/CMP 集群。标准大盘显示 cluster_id 作为必需的集群过滤条件;该 dashboard filter 读取的是由 AutoMQ Prometheus job label 派生出的 Datadog service tag。大盘也会在 AutoMQ 指标暴露 env_id 和 instance_id 时提供对应的可选过滤条件。该 profile 不会从 Kubernetes metadata 合成 env_id 或 instance_id。如果 AutoMQ 指标自身已经带有这些标签,honor_labels: true 会保留 AutoMQ 指标中的值。
建议将 OTEL Agent Gateway 调度到通用节点或独立的观测节点,不需要与 AutoMQ broker/controller 运行在同一节点。若你的 Kubernetes 集群需要自定义 Gateway 的调度策略、资源规格、Pod annotation 或 label,请在 Datadog Helm values 中配置
otelAgentGateway.nodeSelector、otelAgentGateway.affinity、otelAgentGateway.tolerations、otelAgentGateway.podAnnotations、otelAgentGateway.additionalLabels、otelAgentGateway.containers.otelAgent.resources 等参数。可参考 Datadog DDOT Collector Gateway Helm 安装文档 和 Datadog Helm chart values.yaml。
标准大盘采集 profile
推荐配置面向 AutoMQ 客户标准 Datadog 大盘,只保留这些大盘所需的最小维度:
标准最小化 profile 不保留原始 partition 级序列,不保留 topic-by-broker traffic / offset / size 序列,不保留 broker/node 级 JVM、connection、request、latency 或 traffic drilldown 序列,不保留
consumer_group * topic * broker 序列,也不保留未被标准大盘使用的 kafka_stream_* 内部指标、Kafka Linking 指标或 Detailed Metrics 独有的内部诊断维度。
该示例是面向 AutoMQ 客户标准最小化大盘的推荐采集配置。它只采集标准大盘或 rollup processor 必需的原始指标,将 request、traffic、topic、partition、consumer group 源指标转换为低基数
automq_* 聚合指标,并在聚合后丢弃原始源指标,以降低 Datadog custom metrics 数量和标签基数。标准最小化 profile 保留 cluster、topic、consumer group、rack 维度,以及 CPU 和 broker metadata,但不保留 partition 级序列、topic-by-broker 序列、broker/node 级 drilldown 序列,也不保留 consumer-group/topic/broker 三维序列。该示例为 AutoMQ 配置了 Prometheus 抓取任务和指标 pipeline,并使用可选的
infraattributes processor 在相关资源属性可用时添加 Datadog 基础设施标签。OTLP receiver 和其他 pipeline(traces、logs)已省略。如需通过同一 Collector 采集其他应用的 OTLP 数据,请参考 Datadog OTEL Agent Gateway 文档 添加相应的 receiver 和 pipeline。步骤 3:部署 Datadog Agent
添加 Datadog Helm 仓库并创建 Kubernetes Secret 存储 API key:<your-datadog-site> 替换为你的 Datadog Site(例如 datadoghq.com、us3.datadoghq.com、datadoghq.eu)。
步骤 4:验证集成结果
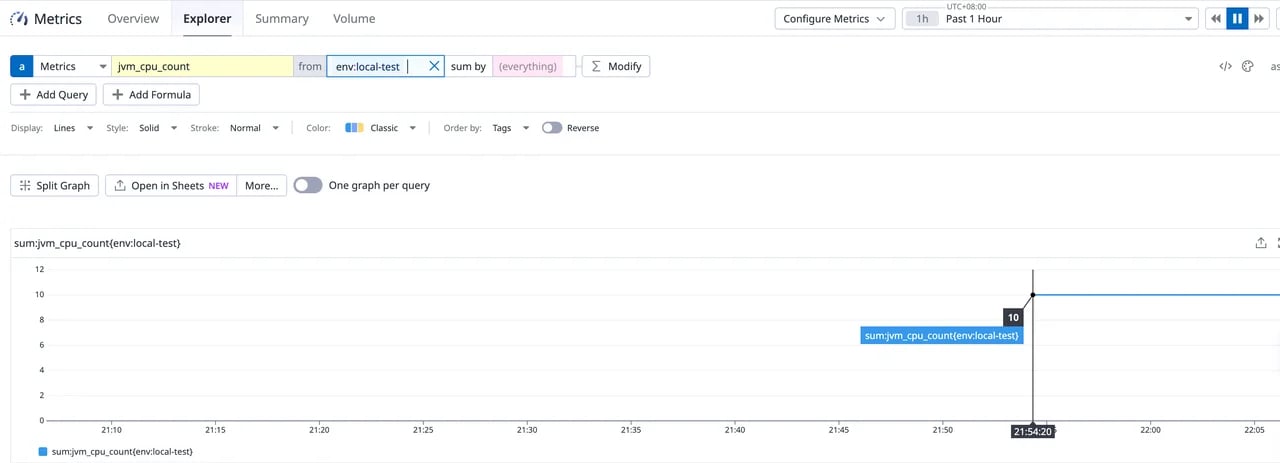
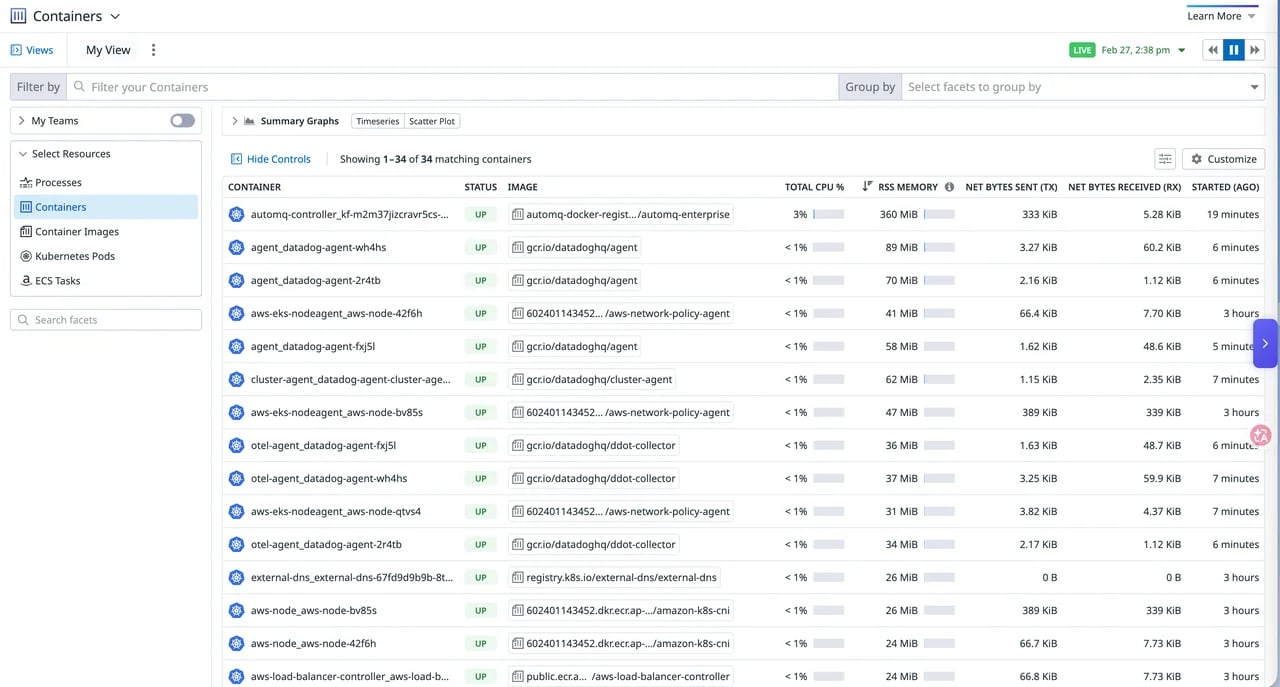
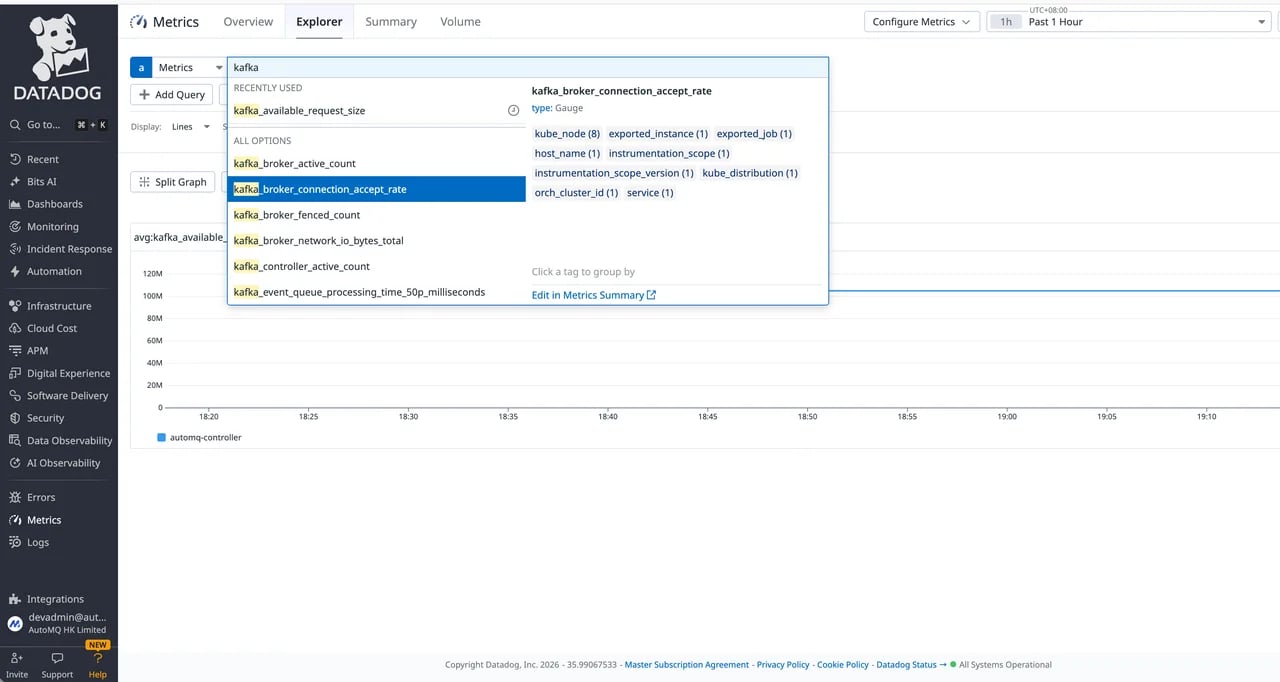
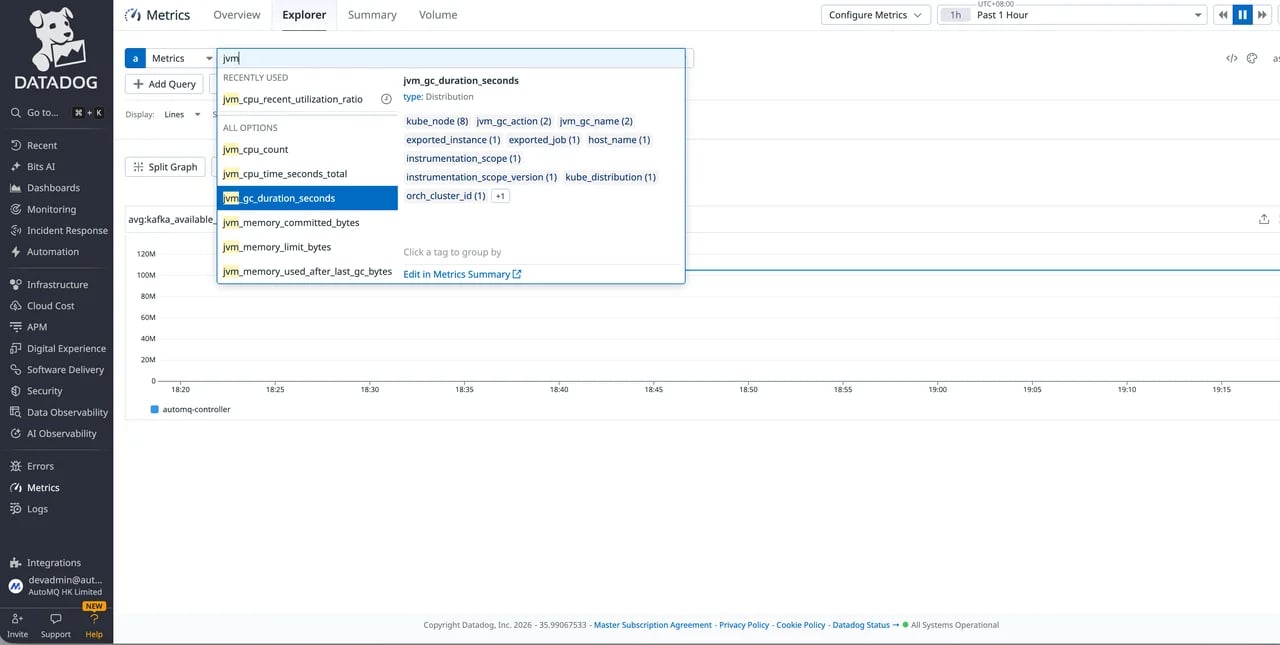
确认 Datadog Agent service account 具备发现 Pod 的权限:- 打开 Datadog,进入 Metrics > Explorer。
- 在搜索栏中输入指标名称前缀,例如
kafka_broker_active_count。 - 使用
service:<your-cluster-id>过滤,确认指标属于预期的 AutoMQ 集群。在导入的大盘中,过滤器名称仍为cluster_id,但其取值来自 Datadogservicetag。如果 AutoMQ 环境原生暴露了env_id或instance_id标签,也可以将它们作为额外过滤条件。 - 新指标可能需要 1–3 分钟才能显示。
步骤 5:导入 AutoMQ Datadog 仪表盘
AutoMQ 指标在 Datadog 中可见后,下载 Datadog 仪表盘 JSON 模板,并导入到你的 Datadog 组织中。
导入仪表盘时,打开 Datadog,进入 Dashboards,创建或打开一个仪表盘,选择 dashboard JSON 导入选项,然后粘贴或上传下载的 JSON 内容。
这些仪表盘模板与步骤 2 中的指标名称、标签和采集降维配置配套使用。Cluster、Topic 和 Group 视图会使用 OTEL transform processor 创建的
automq_* 聚合指标。标准大盘显示 cluster_id 作为必需过滤条件,并映射到 Datadog service tag;当指标存在 env_id 和 instance_id 时,也会提供对应的可选过滤条件。AutoMQ Version 应从节点元数据 gauge(kafka_node_metadata、kafka_node_info 或 kafka_node)发现,并由 dashboard 生成/导入流程渲染。不要从 Helm Chart/App version label 派生,因为该 label 可能与运行时镜像版本不一致。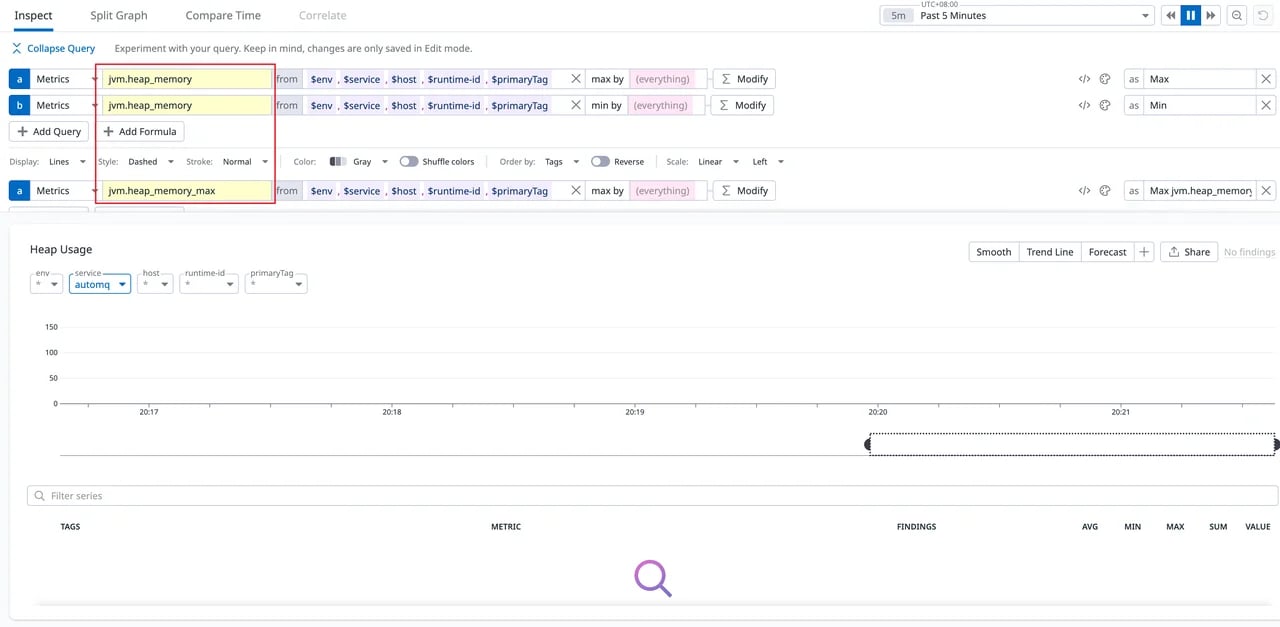
方式二:Linux 环境使用 Gateway OTEL Collector
该方式下,单个 OTEL Collector 或 Datadog DDOT Collector 以 Gateway 方式运行在 Linux 上,并通过 static targets 抓取所有 AutoMQ Prometheus metrics endpoints。Linux 方式复用 Kubernetes 方式中的标准最小化指标降维 profile,区别只在服务发现:Linux 使用静态抓取目标列表,不使用 Kubernetes service discovery。步骤 1:确认 AutoMQ 指标导出
AutoMQ Cloud BYOC 集群默认会暴露 Prometheus metrics endpoint。标准 BYOC 流程不需要修改
server.properties。步骤 2:安装 Collector
请选择一种 Collector 发行版,并保持配置路径和启动方式与该发行版一致。- Datadog DDOT Collector
- Upstream otelcol-contrib
安装内嵌 DDOT Collector 的 Datadog Agent。Datadog 官方 Linux 安装流程通过 如果主机上已经安装 Datadog Agent,请参考 Datadog DDOT Collector 文档 选择与当前 Agent 版本匹配的安装方式。
datadog-agent 管理 Collector,OpenTelemetry Collector 配置文件路径为 /etc/datadog-agent/otel-config.yaml。步骤 3:配置 Collector
创建 Collector 配置文件。下面是标准最小化 profile 的 Linux 版本:使用 static Prometheus scrape targets,只保留标准大盘或 rollup processor 需要的原始指标,创建低基数automq_* 聚合指标,并在聚合后丢弃原始源指标。
请为每个 AutoMQ 集群运行一份该 Gateway Collector 配置,并确保 Collector 所在主机可以访问所有 AutoMQ metrics endpoints。不要在每台 AutoMQ 节点上使用只抓取 127.0.0.1:9090 的相同 profile,因为本地 Collector 会先各自对 counter 做局部 rollup,再导出到 Datadog。
根据选择的 Collector 使用对应配置路径:
- Datadog DDOT Collector:
/etc/datadog-agent/otel-config.yaml - Upstream otelcol-contrib:
/etc/otelcol/config.yaml
当
honor_labels: true 时,如果被抓取的 AutoMQ endpoint 已经暴露 Prometheus job label,则会保留 endpoint 提供的值,job_name 不会覆盖该 label。标准 AutoMQ 指标通常会将 job 暴露为集群标识,Datadog 会将该 label 映射为标准大盘 cluster_id 过滤器使用的 service tag。如果 endpoint 未暴露 job,则 job_name 会作为 fallback 值。静态 env_id 和 instance_id 标签是可选配置;仅当你希望 Linux 采集路径下这些 Datadog dashboard filters 有可选值时才需要设置。该 Gateway profile 的 rollup 在 Collector 侧完成,用于降低 Datadog custom metrics 基数。它不等价于 Prometheus recording rule,不能表达跨 scrape target 的
max by (..., partition) 后再 sum by (...)。如果需要在分区迁移期间严格去重同一个 partition 被多个 AutoMQ 节点短暂同时暴露的 gauge,请在 Datadog 之前增加 Prometheus recording rule / federation 层,或保留 partition 维度并在 Datadog 查询侧单独处理。步骤 4:启动 Collector
- Datadog DDOT Collector
- Upstream otelcol-contrib
重启 Datadog Agent,并确认内嵌 Collector 状态:
步骤 5:验证
打开 Datadog Metrics > Explorer,搜索 AutoMQ 指标,例如kafka_broker_active_count,并使用 service:<expected-cluster-id> 过滤。在导入的大盘中,过滤器名称仍为 cluster_id,但其取值来自 Datadog service tag。如果没有出现预期的 service 值,请检查一个 AutoMQ /metrics endpoint 中实际暴露的 job label,因为 honor_labels: true 会保留 endpoint 提供的 job 值。如果 AutoMQ 环境原生暴露了 env_id、instance_id 或 broker_id 标签,也可以将它们作为额外过滤条件。新指标可能需要 1–3 分钟才会出现。