

Shared storage architecture of AutoMQ
AutoMQ separates the WAL from the storage of retained data. Brokers first persist incoming records to the WAL, then upload them to object storage. This allows the WAL storage service to be selected independently from the service that holds retained data. In the tested Azure deployment, Azure Zone-redundant Disk provides the WAL storage, and Azure Blob Storage holds retained data. See WAL storage for the storage architecture.Deployment configuration on Azure
Azure’s zone-redundant storage (ZRS) synchronously replicates managed disks across three availability zones (AZs). In the tested deployment, each broker uses a Premium SSD with ZRS for its WAL, while Azure Blob Storage holds retained data. Synchronous replication across zones adds latency to the WAL write path. See Azure managed disk redundancy for the service’s replication and recovery behavior. The main cluster test used the following configuration on Azure Kubernetes Service (AKS):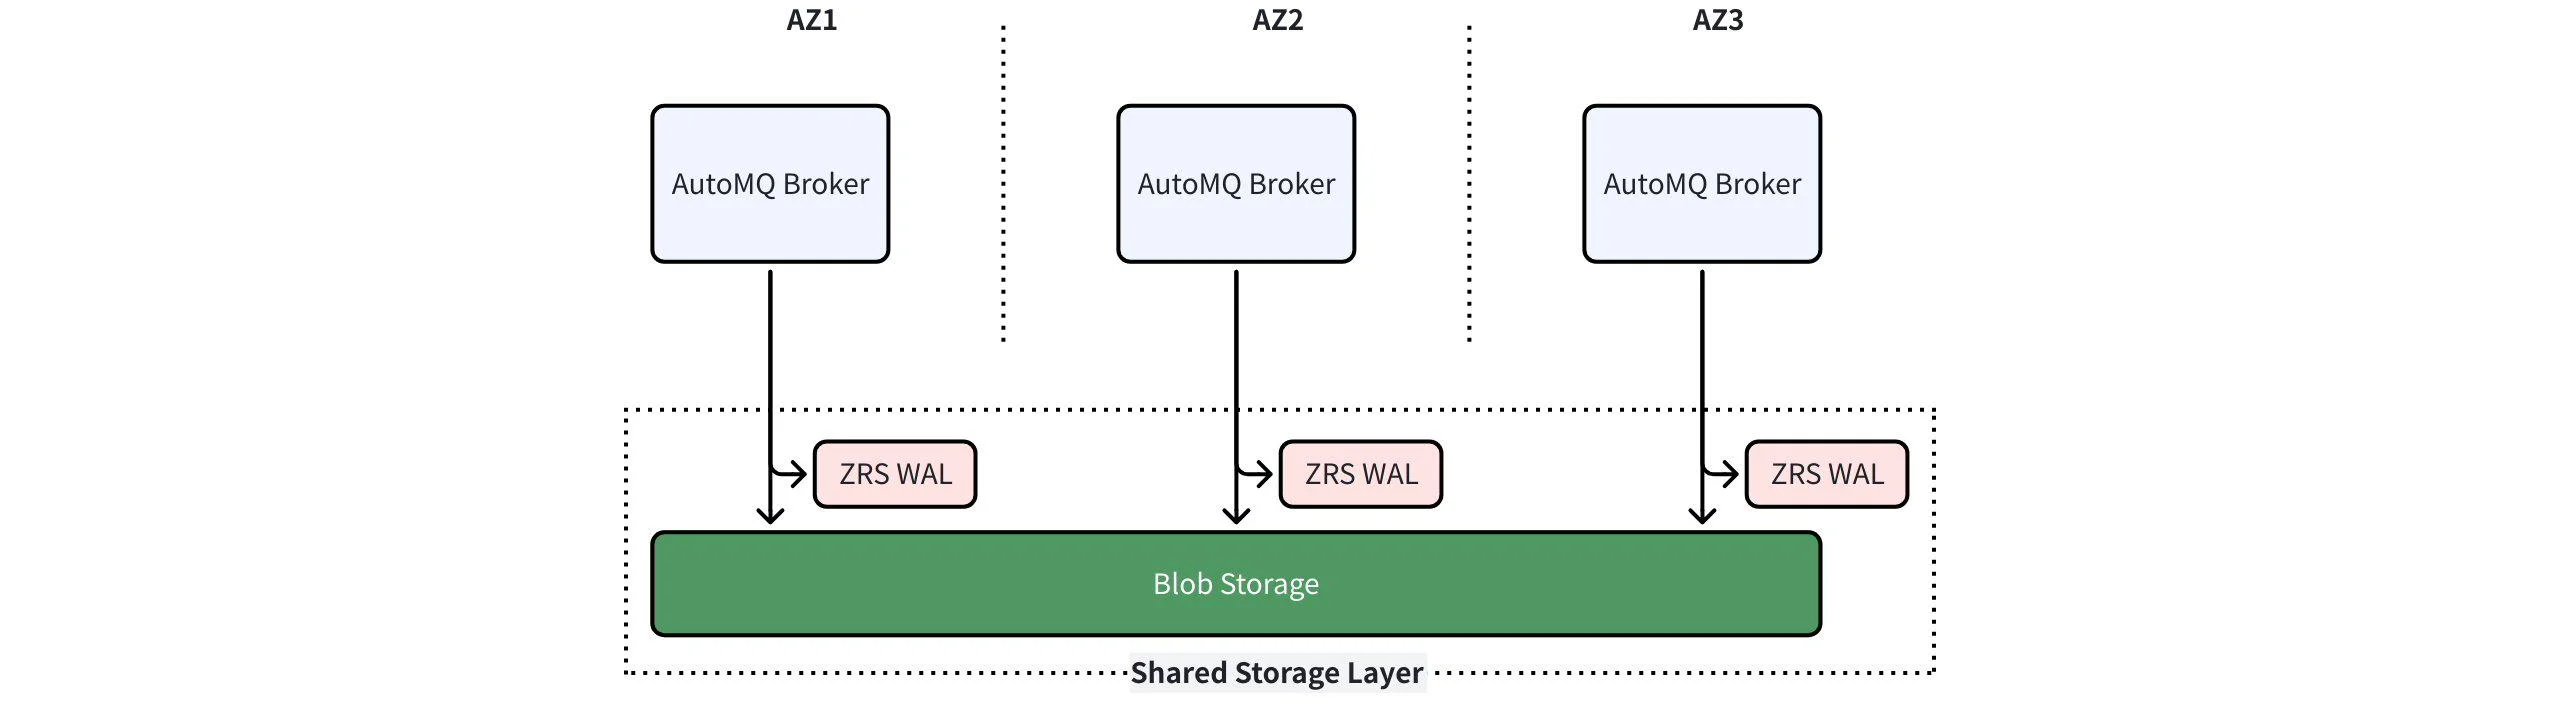
P10, P15, and P20 are Azure Premium SSD tiers. Increasing the tier increases both capacity and baseline I/O performance:
The WAL itself required only a few GiB. The main test selected P20 for its I/O performance, rather than to hold retained Kafka data. Both the VM and disk impose I/O limits: D4as v5 has a documented uncached Premium SSD throughput limit of 144 MB/s before bursting. Check the Dasv5 VM specifications and Premium SSD tiers when reproducing the test.
Benchmark setup
The tests used automq-perf-test.sh, a performance testing tool included in the AutoMQ open-source project. Its implementation draws on the core logic of OpenMessaging Benchmark. It runs multiple producers and consumers within a single process and reports produce and consume throughput, produce latency, and end-to-end latency percentiles. See AutoMQ Benchmark for usage and workload configuration. The workload used fixed 64 KiB records and disabled producer batching. This reduces differences caused by client batching; the results do not represent the latency of individually sent small records.
Produce latency measures the time to receive the produce acknowledgment. End-to-end (E2E) latency also includes consumption. Azure service specifications use decimal MB/s; measured throughput below uses binary MiB/s.
After deploying AutoMQ on Azure AKS, use this command as the starting workload for the main cluster test. Replace the bootstrap address with your cluster endpoint.
Benchmark results
High-throughput cluster test
The 15-broker D4as v5 / P20 cluster was tested with a target of 16,640 records/s, or 1,040 MiB/s, approximately 1 GiB/s. The measured average produce and consume throughput was 778.09 MiB/s, with zero producer errors.
The median produce latency was 8.125 ms, while P99 was 27.538 ms. The higher percentiles show intermittent spikes that matter for latency-sensitive workloads.
WAL disk comparison at 120 MiB/s
The P10 and P15 trials used E2as v5 VMs, one topic with 96 partitions, 24 producers, and 24 consumers in one group. Both achieved 120.05 MiB/s produce and consume throughput with 64 KiB records.
At the same throughput, the P15 configuration had lower average and P99 latency. Average produce latency was 6.909 ms for P15 and 7.996 ms for P10; produce P99 was 18.398 ms and 21.597 ms, respectively. The P10 run used a WAL queue depth of 16 and an IOPS limit of 400.
Additional runs at 150–180 MiB/s
This test used a 128 GiB WAL disk, queue depth 16, and an IOPS limit of 400. The workload ran twice at approximately 150 MiB/s and once at 180 MiB/s.
At approximately 150 MiB/s, average produce latency was 9.121 ms and 8.773 ms across the two runs, with E2E P99 of 38.114 ms and 60.041 ms. At 180.05 MiB/s, average produce latency was 10.831 ms and E2E P99 was 44.476 ms.
Partition and client concurrency at 300 MiB/s
Two D4as v5 / P20 tests targeted 300 MiB/s, using 4,800 records/s of 64 KiB each. The second configuration doubled both the partition count and producer/consumer concurrency.
Average E2E latency was 8.101 ms in configuration A and 7.647 ms in configuration B. E2E P99 was 21.261 ms and 21.853 ms, respectively. Both configurations used a WAL queue depth of 32 and an IOPS limit of 1,000.